-
Categories
-
Archives
The Cutting Edge of Blade Shape Technology!
December 10, 2012 at 5:04 pm
Noise and Shadow Flickers from Wind Turbines: Are There Health Effects?
December 10, 2012 at 3:27 pm
Alice Ly
EK132 MC
Professor Grace
November 28, 2012
Noise and Shadow Flickers from Wind Turbines: Are There Health Effects?
In order to live in today’s society, people need resources to power the energy they use. One of the most eco-friendly approaches is to use wind turbines to generate electricity. However, there are many proposed adverse effects from wind turbines. Noise and shadow flickers produced by wind turbines are two major elements associated with possible health problems. While individuals have stated many different health effects from noise (for example, an increase in psychological distress and physiological stress), the leading possible health impact is caused by sleep disturbance. There is not enough evidence to prove that shadow flickers can lead to health problems; however, possible health impacts of shadow flicker can be kept at a minimum if the turbines are placed at an adequate distance from residences and operated at hours when shadows are not intense. Noise control, on the other hand, is more challenging. More measures are being taken to minimize the noise generated from wind turbines, such as adaptive approaches and blade modifications. Ultimately, there is no way to completely eliminate the existence of noise from a wind turbine; the only approach is to place them far away from residences. Thus, more research is needed to not only determine whether or not wind turbines really cause health problems, but also to minimize the aspects of it that some consider unhealthy.
Noise is the dominant source of complaint from wind turbines. Many have stated that there are health effects associated with noise. In a letter to Senator Doug Cameron, Dr. Sarah Laurie, a CEO from the Waubra Foundation, stated that there have been serious health symptoms caused by wind turbines, such as acute vestibular dysfunctions and disorders, acute sympathetic nervous system stimulation, combined psychological and physiological stress, and tissue damage (Laurie)7. She derives her claims from Dr. Pierpont’s research on low frequency noise exposure, various articles on noise, stress, and sleep deprivation, and wind turbine research from National Wind Watch. Her sources show that stress, sleep deprivation, and noise do cause health problems, but there are no articles that can reliably prove wind turbines as instigators. McEwen, one of her sources, studied the cause and effects of stress, but never directly states wind turbines as one of the causes of stress8.
There is little significant evidence that wind turbines actually cause these health effects. It is concluded in “Infrasound and Low Frequency Noise from Wind Turbines: Exposure and Health Effects” that “there is no evidence that infrasound at these levels contributes to perceived annoyance or other health effects” (Bolin, et al.)2. Three research studies were conducted to measure noise annoyance, and overall, about 6% of the participants were very annoyed by noise levels from 35-40dB. This percentage is about the same as research conducted on annoyance due to traffic noise. Out of all the participants, no health problems were mentioned. In addition, Bolin also disclaims Dr. Pierpont’s study on health problems caused by wind turbines. “The study has several limitations, which makes the conclusion unjustified. For example, the lack of acoustic measurements, no comparison group of people with no or low wind exposure and no investigation of the subjects prior to the wind turbines were constructed (prior health status was estimated retrospectively)” (Bolin, et al.)2. Dr. Pierpont’s study consists of 38 participants, which is too small of a sample to make an established claim.
There are people that have posted videos online showing shadow flicker and intense noise from wind turbines. However, Phil Bloomstein’s video showed only small snippets of various places in and outside of the house. It never stated for how long the shadow flickers occurred, and when. The video showed sunshine that was not bright, indicating that the sun was most likely behind the wind turbine, which would cause shadow flickers, but not for long. It was possible that he filmed it “just a little after the sunrise and just a little before the sunset” (Katsaprakakis)6. “According to the Hellenic legislation, the minimum distance between a wind park and a settlement is 500 m.” (Katsaprakakis)6. The wind turbine in the Bloomstein’s video was 1,000 feet away from residences4. Therefore, it more than fulfills Hellenic legislation. The Nation Wind Watch website also claimed that the noise level at Bloomstein’s house was approximately 50dB, but the videos were not available for viewing. Larry Wunsch’s video also showed shadow flicker in the same situations. The noise in his video seemed loud, but it was clear that he was really close to the wind turbines in the video9, which means that the sound level is not the same near his house, invalidating his noise claims.
Although there isn’t enough evidence to prove that noise and shadow flicker from wind turbines contribute to health problems, there have been many different approaches to minimize these aspects. Firstly, adaptive approaches like speed and pitch modifications, which reduce noise, have been considered, although reduction in noise also means a reduction in the power generated5. However, “despite the loss in power, the main advantage of wind turbines with optimized operating conditions is that the acoustically affected areas are much smaller, allowing more wind turbines to be built in a specified area” (Jianu, et al.)5. In addition to that, there have been blade modifications that can reduce noise but not power. “By breaking down the noise sources it can be seen that the maximum noise contribution occurs within the trailing edge” (Jianu, et al.)5. Thus, there have been many different studies to minimize noise through this aspect. One way is to replace existing airfoils with acoustically enhanced airfoils. The noise was found to be reduced by about 1-3 dB5. Another way is to place a row of polypropylene fibers on the trailing edge, which would be aligned with trailing edge flow, and the study showed that a noise reduction from 2 to 10 dB was seen5.
Overall, many studies have either concluded that noise and shadow flicker from wind turbines do not effect health, or that there is not enough evidence to support the claim that they cause health problems. In the “Wind Turbine Health Impact Study: Report of Independent Expert Panel,” it is concluded that there is limited scientific and epidemiologic evidence that either noise or shadow flicker contributes to health problems. In “Impact of Wind Turbine Sound on Annoyance, Self-reported Sleep Disturbance and Psychological Distress,” it is concluded that “no direct effects of wind turbine noise on sleep disturbance or psychological stress has been demonstrated, which means that residents, who do not hear the sound, or do not feel disturbed, are not adversely affected” (Bakker, et al.)1. However, even though there have been no direct health affects, advances have still been made in noise reduction, including adaptive approaches and blade modifications. But these approaches can only go so far as to reducing noise without sacrificing power. In the end, one still has to be sacrificed. The problem is, which one is more worth it?
Sources:
1. Bakker, R.H., E. Pedersen, G.P. van den Berg, R.E. Stewart, W. Lok, and J. Bouma. “Impact
of Wind Turbine Sound on Annoyance, Self-reported Sleep Disturbance and Psychological Distress.” Science of the Total Environment 425 May 2012: 42-51. Compendex. Web. 28 Nov. 2012.
2. Bolin, Karl, Gӧsta Bluhm, Gabriella Eriksson, and Mats E. Nilsson. “Infrasound and Low
Frequency Noise from Wind Turbines: Exposure and Health Effects.” Environmental Research Letters 6.3 July-Sept. 2011: 035103-09. Inspec. Web. 25 Nov. 2012.
3. Ellenbogen, Jeffrey M., et al. “Wind Turbine Health Impact Study: Report of Independent Expert Panel.” January 2012. Massachusetts Department of Environmental Protection
Massachusetts Department of Public Health. Web. 26 Nov. 2012. <http://www.mass.gov/
dep/energy/wind/turbine_impact_study.pdf>.
4. Freedom Windmills Shadow Flicker. Prod. Phil Bloomstein. Wind-watch.org. National Wind Watch. Web. 26 Nov. 2012. <http://www.wind-watch.org/video-freedom-maine.php>.
5. Jianu, Ofelia, Marc A. Rosen, and Greg Naterer. “Noise Pollution Prevention in Wind Turbines: Status and Recent Advances.” Sustainability 4.6 June 2012: 1104-17. Inspec. Web. 26 Nov. 2012.
6. Katsaprakakis, Dimitris Al. “A Review of the Environmental and Human Impacts from Wind Parks: A Case Study for the Prefecture of Lasithi, Crete.” Renewable and Sustainable Energy Reviews 16.5 June 2012: 2850-63. Compendex. Web. 26 Nov. 2012.
7. Laurie, Sarah. "List of Symptoms and Medical Problems." Letter to Doug Cameron. 22 Nov.
2012. wind-watch.org. National Wind Watch. Web. 26 Nov. 2012. <http://docs.wind-watch.org/Laurie-List-of-symptoms.pdf>
8. McEwen, Bruce. “Protective and Damaging Effects of Stress Mediators” New England Journal of Medicine 338 1998: 171 – 179. Web. 28 Nov. 2012. <http://www.nejm.org/doi/full/10.1056/NEJM199801153380307>.
9. Wind Turbine Shadow Flicker and Noise, Byron Wisconsin. Prod. Larry Wunsch. Wind-
watch.org. National Wind Watch. Web. 26 Nov. 2012. < http://www.wind-watch.org/video-wisconsin.php>.
Needed Reform in Italian Wind Energy Policy
December 3, 2012 at 11:55 pm
Peter Tranoris
Grace EK132
12/03/12
Italy has many opportunities available in the field of renewable energy. Its use of renewable energy sources is increasing. With large onshore and offshore wind resources, especially in southern Italy, wind energy can be a major contributor to Italian energy production. Despite growth, Italy’s wind and other renewable energy sources are not being used to their full ability. A combination of government and bureaucratic hurdles, along with corruption, stand in the way, and may even halt the growth of the renewable energy industry. As Italy’s dependence on foreign sources of energy grows, the country needs to take more steps to grow its wind energy industry.
In recent years Italy has taken steps to improve their use of renewable energy sources. In the past, the majority of renewable energy produced by Italy was from hydropower and geothermal sources. Wind power output has increased steadily for the past decade, recently passing geothermal output (Going with the Wind). Subsidies and feed in tariffs (FiT) are growing the solar energy industry, and FiTs are planned to take effect next year for the wind energy industry. FiTs were a major contributor to the success of renewable energy in other European countries (Italy: Renewable Energy Law Adopted). In addition, development has begun for Italy’s first offshore wind projects (C., Tricoli).
In spite of what seems to be a successful wind energy policy, government regulations are actually negatively affecting the renewable energy industry. Bureaucratic hurdles and a complicated permitting process have limited the number of large wind farms built (Rosenthal). With all of the bureaucratic problems, the only reason the wind energy industry has grown rapidly has been through massive government subsidies, considered the most generous in the world (Meo). These incentives have risen to over six billion euros a year (Raizada). With growing budget deficits and the effects of the recession, the new Italian government is cutting back on spending, and implementing a feed in tariff system for wind energy. The news of a FiT for the wind energy worries some in the energy industry. The new FiT will reportedly come with a “less generous, more bureaucratic system,” which will lead to a “strong reduction in new wind capacity” (O’Brian). Instead of helping Italy as it did in other European countries, a FiT may stop progress in the wind energy industry, cutting off the subsidies it relied on.
The massive subsidies of the past years have led to negative side-effects in the wind industry. The large government handouts have attracted the mafia and other illegitimate entrepreneurs. In Italy “the Mafia has years of expertise at buying corrupt politicians and intimidating rivals,” leading to corruption at all levels of the wind energy industry (Meo). The mafia has been fraudulently skimming money from the subsidies, costing the public as much as 35 billion euros over the past decade (Italy: Renewable Energy Law Adopted). Recently, the government had to seize several wind farms in Sicily, after the mafia invested illegally in them (O’Brian). So called “Clean-Energy” schemes have led to wind farms standing derelict or never being constructed in the first place. If corruption continues, it could greatly affect the wind energy industry, and it is already negatively affecting public opinion of wind turbines in areas of southern Italy (Meo).
|
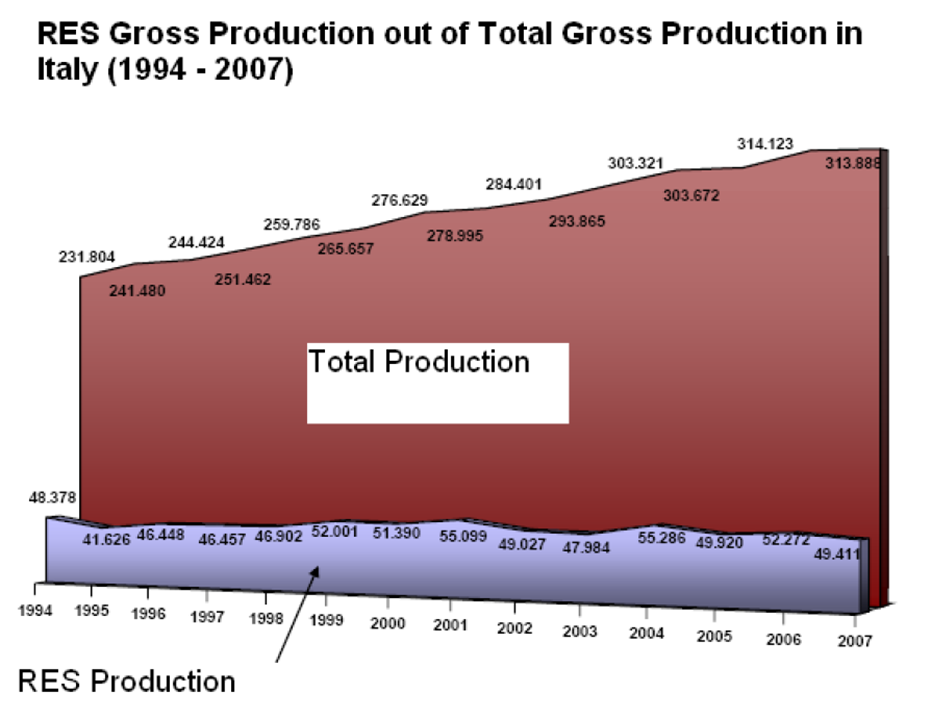
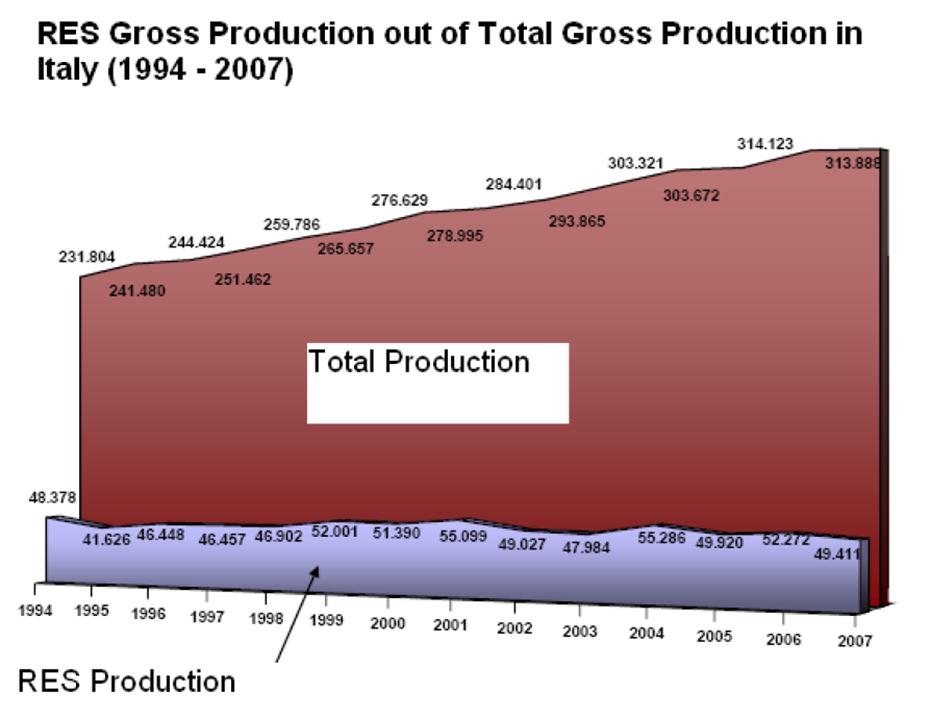
Figure 1. Total gross energy production and RES (RenewableEnergy Source) gross production in Italy from 1994 to 2007. Measured in GW/h. |
Figure 1 shows that the gains in wind energy have done little to increase the overall share of renewable energy sources compared to overall energy production (Renewable Energy Policy Review). While production of wind energy rises, decreases in other sectors, such as hydropower has occurred. This leaves Italy highly dependent on other sources on energy, including foreign energy sources, which account for almost 86% of its total energy needs, the highest of any G8 country (Going with the Wind). With the closing of its last nuclear power plants in the 1990s, and recent public referendums against nuclear power, Italy has had to directly import electricity from its neighbor France. There are few remaining options available, except for needed increases in wind and solar power.
Despite all of the efforts taken to grow the wind industry over the past decade, there is much more Italy can do. Unsustainable past government policies and harsh new policies threaten the gains made, and corruption is as much a problem as ever. If Italy wants to lessen its dependence on foreign energy sources, it will have to do more to encourage affordable, steady, and sustainable growth in the wind energy industry, lessening regulations and bureaucratic red tape.
Works Cited
C., Tricoli and Barsanti M. and Delbono I. “Offshore wind farms along the Italian coasts: a first selection of suitable areas based on wind and bathymetric data.”Owemes (2006). n. pag. Web. 1 Dec 2012.
“Going with the Wind: Italy tries to wean itself off imported energy—but it has a long way to go”. The Economist. 4 Jul. 2009. Web. 1 Dec 2012.
Italy: Renewable Energy Law Adopted. Global Legal Monitor. Library of Congress. 25 Mar. 2011. Web 1 Dec. 2012.
Meo, Nick and Nick Squires. “Mafia cash in on lucrative EU wind farm handouts— especially in Sicily.” The Telegraph. 5 Sept. 2010. Web. 1 Dec 2012.
O’Brian, Heather. “Italian legislation forces wind farm sales.” Wind Power Monthly. 2 Oct. 2012. Web. 1 Dec 2012.
Pirazzi, Luciano, and Cesare Silvi. “Wind Power in Italy from the Late 1970s to the Present.” Gruppo per la storia dell’energia solare. n. pag. Web. 1 Dec 2012.
Raizada, Rachana. “Will Italy's FiTs Survive the Fall of Berlusconi?” Renewable Energy World.com. 21 Feb. 2012. Web. 1 Dec 2012.
“Renewable Energy Policy Review” European Renewable Energy Council. Mar. 2009. Web. 1 Dec. 2012
Rosenthal, Elisabeth. “Thinking Small, and Still Smaller, on Wind Power.” The New York Times. 29 Sept. 2010. Web. 1 Dec 2012.
Health Impact- the Dubiousness of Infrasonic Harm
December 3, 2012 at 6:11 pm
One of the most prevalent concerns regarding the possibility of wind turbines’ effect on human health is the phenomenon of infrasound. Though infrasound is by no means a unique product of turbines but rather a product of all machinery and natural forces such as the wind or ocean, the propagation of wind turbines has been associated with symptoms in proximate people which are debatably identified as the result of infrasound. Across the human range of hearing, the frequencies of roughly 20-20,000 Hz are typically heard at any volume. Infrasound, which is described as sound with frequency roughly less than 20 Hz, is too low for humans to feel unless its volume reaches high levels- 60-100 dB, somewhere between the volume of a coffee grinder to a moving truck (2). But though infrasound cannot usually be heard, an exceeding amount of data suggests that what you cannot hear can hurt you. At the same time, however, there are effective counterarguments which may just as easily disprove infrasound as a legitimate threat to human health. Because it seems equally likely that the discomfort and pain experienced by many in the vicinity of turbines is caused by infrasound as it is that they are psychosomatic, more research needs to be done on how infrasound affects humans before either perspective is embraced.
| Threshold | Sound Pressure at Various Frequencies (8) | |||||
| 10 Hz | 12.5 Hz | 16 Hz | 20 Hz | |||
| Hearing Threshold | 103 dB | 95 dB | 87 dB | 79 dB | ||
| Perception Threshold | 100 dB | 92 dB | 84 dB | 76 dB | ||
Though infrasound cannot be heard, it still exists and can affect people for what sound really is- vibration. Thus, though otherwise silent, infrasound is capable of moving internal organs to some degree, thus instigating nausea, and high volumes regardless of frequency can stimulate the fight-or-flight reaction, increasing heart rate and blood pressure (East Coast Research and Investigation of the Paranormal). Additionally, because lower-frequency air pressure pulses lose much less energy than higher frequencies of sound, infrasound is capable of causing walls to resonate thus entering houses which are insulated against audible noise. Because infrasound is usually masked by higher frequencies of sound, it is therefore possible for people to have relatively more exposure to infrasound while indoors (4).
There exists a plethora of studies which account for the symptoms observed. Robert Rand, a member of the Institute of Noise Control Engineering (INCE) and a technician with 30 years of experience, stumbled upon symptoms of the infamous “Wind Turbine Syndrome” himself. Having been asked to investigate the potential danger of wind turbines on a site in Maine, Rand and a colleague from the INCE both experienced “nausea, loss of appetite, headache, vertigo, dizziness, inability to concentrate, an overwhelming desire to get outside, and anxiety” upon entering a building near the turbine (1). Another example would be a survey conducted by Zhenhua Wang, a graduate student in Geography, Environment, and Population at the University of Adelaide, Australia. The survey asked civilians living within 5 km of a wind farm whether or not they were negatively affected by the noise, and it yielded that 70% of them were, 50% being “very or moderately negatively affected.” Only 35% of the surveyers were actually opposed to wind energy, dissuading the possibility of psychosomatic influence (6). Furthermore, in line with the hypothesis that excessive infrasound can cause discomfort through the vibration of internal organs, people who have had wind turbines installed near their homes have reported a variety of symptoms which did not exist before the turbines' installation. They feel internal pressure and have heart issues- as the average heartbeat is less than 1.25 Hz, a frequency within the range of infrasound itself, pervasive vibrations from excessive infrasound may be the cause (4).
Yet, there exist several convincing counterarguments as well. First, research shows that wind turbines are not quite as loud as some people believe. A widely accredited study in Denmark by Moller and Pederson revealed that houses beyond 1414 m, or 4600 ft, from 3 MW turbines receive 35 dB of sound. As the hearing/perception threshold for infrasound is about 70 dB, and because decibels work on a logarithmic scale, this means that houses a reasonable distance away from turbines do not receive levels of infrasound remotely close to levels at which they are believed to be felt (7). Also, prevalent symptoms thought to be caused by wind turbines, especially in Australia, are in fact naturally occurring. Roughly 29% of Australian adults have hypertension, though half of them are aware of it. Similarly, around 5% of Australian adults have insomnia- so, when they are diagnosed for the first time, civilians suffering from hypertension or insomnia will not attribute it to natural causes and will instead assume that it is the result of nearby wind turbines' “notorious infrasound.” Similarly, the fear and panic spread by many anti-wind activists is likely to cause a “nocebo” effect, which is conjugate to the placebo effect- after being told to expect to acquire disease or symptoms, people will develop them. Perhaps most concerning about the argument that wind power's infrasonic influence is detrimental to human health is the fallacious and misleading citations by its most well-known activists. Sarah Laurie, who never received a doctorate, is one such icon of the anti-wind movement. In one document, Laurie cited evidence that infrasound produced harmful effects in humans, and thus wind turbines were easily responsible for a multitude of symptoms. What she failed to mention is that the evidence applied to infrasound at extremely high volume- 125 dB or more- and that wind farms will emit at most about 65 dB in their direct vicinity and less over a distance. Nina Pierpont, the New York Pediatrician who coined the term “Wind Turbine Syndrome,” misquotes a study by Todd et al published in the journal Neuroscience Letters as a foundational support in her argument- “The very low [noise] thresholds we found ar remarkable as they suggest that humans possess a frog- or fish-like sensory mechanism which appears to exceed the cochlea for detection of substrate-borne low-frequency vibration and which until now has not been properly recognised.” The actual study does not pertain to “noise,” which Nina Pierpont inserts, but rather substrate-borne vibration, and though the author has publicly responded to this quotation with the statement that his research shows no evidence that hypothesized acoustico-physiological mechanisms are caused by the sound of turbines, she continues to misuse the quotation (9). If the scientists arguing for the harmful effects of infrasound are not credible, so too is their argument.
Currently, there is not enough research on the effects of infrasound on humans to classify turbines as harmful or harmless. Studies by scientists such as K Persson Waye of Alborg University, Denmark, conclude that “present studies are not conclusive with regard to objectively measured effects,” because mechanisms and models need to be developed to control varying factors in infrasound exposure (5). This must be dealt with- even the Department of Environmental Protection does not test for infrasound when deeming institutions safe because their policy is not defined to cover anything but audible sound (3). Once this policy is changed, and proper research is conducted, the nature of wind turbines will actually become clear- the truth must be found before any action can be taken.
Works Cited
- Lloyd, Graham. The Australian. “What you can't hear can hurt you.” January 25, 2012. Retrieved November 29, 2012. http://www.theaustralian.com.au/news/features/what-you-cant-hear-can-hurt-you/story-e6frg6z6-1226252801681
- Author unknown. East Coast Research and Investigation of the Paranormal. “Infrasound.” Date unknown. Retrieved November 28, 2012. http://www.eastcoastrip.org/did-you-know/infrasound
- Wittenberg, Ariel. South Coast Today. “Infrasound remains controversial, mysterious.” July 1, 2012. Retrieved November 29, 2012. http://www.southcoasttoday.com/apps/pbcs.dll/article?AID=/20120701/NEWS/207010342
- Post, Willem. The Energy Collective. “On Wind Turbine Noise and Air Pressure Pulses.” May 7, 2012. Retrieved November 27, 2012. http://theenergycollective.com/willem-post/84293/wind-turbine-noise-and-air-pressure-pulses
- Waye, K Persson. Noise & Health. “Effects of Low Frequency Noise on Sleep.” 2004. Retrieved November 29, 2012. http://www.noiseandhealth.org/article.asp?issn=1463-1741;year=2004;volume=6;issue=23;spage=87;epage=91;aulast=Waye
- Zhenhua, Wang. National Wind Watch. “Evaluation of Wind Farm Noise Policies in South Australia: a Case Study of Waterloo Wind Farm.” February 29, 2012. Retrieved November 29, 2012. http://www.wind-watch.org/documents/evaluation-of-wind-farm-noise-policies-in-south-australia/
- Author unknown. The Acoustic Ecology Institute. “Recent research on low frequency noise from wind turbines.” December 31, 2011. Retrieved November 27, 2012. http://aeinews.org/archives/1711
- Author Unknown. Bavarian State Office for Environment, Bavarian State Office for Health and Food Safety. “Windkraftanlagen – Beeinträchtigt Infraschall die Gesundheit?” Date unknown. Retrieved November 27, 2012. http://www.lfu.bayern.de/umweltwissen/doc/uw_117_windkraftanlagen_infraschall_gesundheit.pdf
- Chapman, Simon. Reason Australia. “Is 'Wind Turbine Syndrome' Mass Hysteria?” Date unknown. Retrieved November 29, 2012. http://www.reasonaustralia.org/news/articles/216-is-wind-turbine-syndrome-mass-hysteria
Group 3 Blade Testing Analysis
December 3, 2012 at 5:54 pm
Our JPEG files of our blades are for the 5.5 inch blades. Our 4 inch blades and 7 inch blades look exactly the same but one is shorter and the other is longer, respectively.
EK 132 Blade Testing Blog Post
Group #1 Blade Testing Results
December 3, 2012 at 5:52 pm
Large Ellipse (wingspan 4 in, chord 2 in)
Medium Ellipse (wingspan 5.5 in, chord 2 in)
Small Ellipse (wingspan 7 in, chord 2 in)
Long Rounded Ends (wingspan 7 in, chord 2 in)
EK 132 Group #2 Blade Testing Results
December 3, 2012 at 5:09 pm
The link below is an example of the blade geometry:
The data that you will see displayed below is based on most variables in the system remaining constant. The constant variables in this experiment were the oval shape of the blade, the 15 degree pitch that all of the blades were set at, the 2-11 miles per hour wind velocity tested at for all of the blades, the same six inch span of the blades, and the system for testing the blades. The only variable that was change and monitored throughout the experiment was the various chord lengths that we tested at and the number of blades that we placed on the turbine during each test (i.e. 3, 4, or 6 blades). Our chord lengths varied between 1”, 1.5”, 1.9”, 2.0”, and 3.0”. One thing that is to be noted is that originally we wanted to test blades at increments of 0.5”, but human error caused the 2.5” blades to actually be 1.9”.
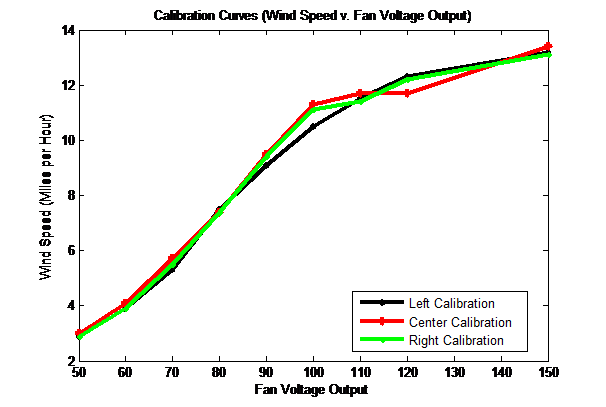
The above graph shows a calibration curve for the wind tunnel before testing. The graph displays a pretty even distribution of wind speed throughout the tunnel. Even though the speed may vary with certain fan voltages the speeds are basically the same throughout.
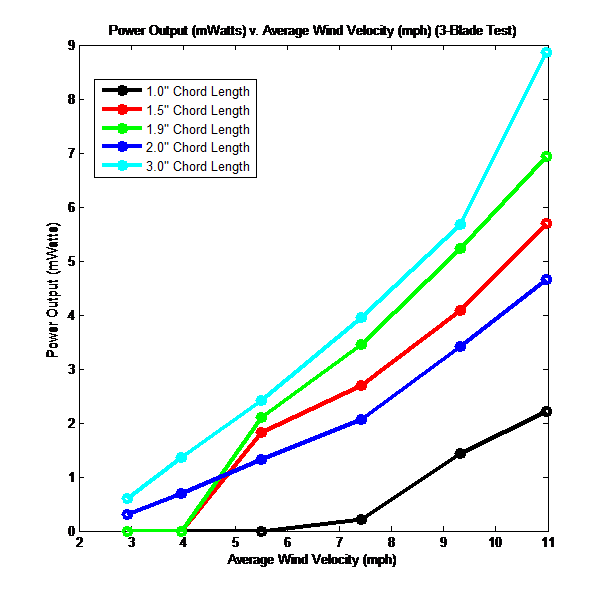
The above graph shows the power output versus the average wind velocity for the tests involving three blades on the wind turbine. In this portion of the experiment all of the shapes are the same, oval, but the difference between them is the various chord lengths. According to the graph the blades with the three inch chord length had the highest power output versus the other blades, while the one inch blade length had the least amount of power output. Even though it was expected that the three-inch blades would have the highest output and the one-inch blades would have the lowest output, the blades with the 1.5 inch, 1.9 inch, and 2.0 inch chord lengths show a different trend. Our group believed that the power output would be highest with the highest chord length, but the data shows that the 1.9 inch blade chord length had the second highest result, then the 1.5 inch chord length, and finally the 2.0 inch chord length. This may be a result because this test did not reach the maximum power output, so no conclusion can be based on this data, until this maximum is reached.
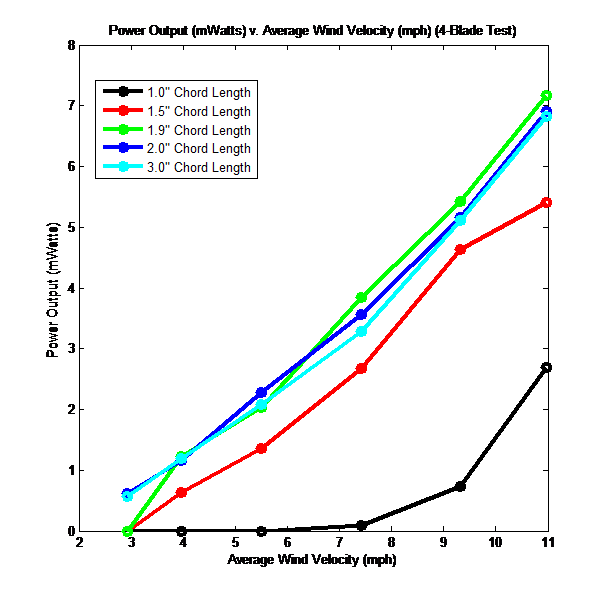
From the above graph, we can say that once again the 1.0” chord length performs the worst. The 3.0” chord length blade was again at or near the best output; however the 1.9” and 2.0” chord length blades performed extremely close to that of the 3.0” chord length blade. We did notice that the 1.9” chord length blade did not perform very well at very low wind speeds as you can see the curve for that blade is well below that of the 3.0” chord length blade. Out of the three(1.9”, 3.0”, 2.0”) chord length blades at high wind speeds, we cannot determine which will perform the best considering that they are so close in terms of output and the power curves haven’t come near to reaching their maximum output. Had we been able to test the blades up to their actual output maximum, we may see a large difference.
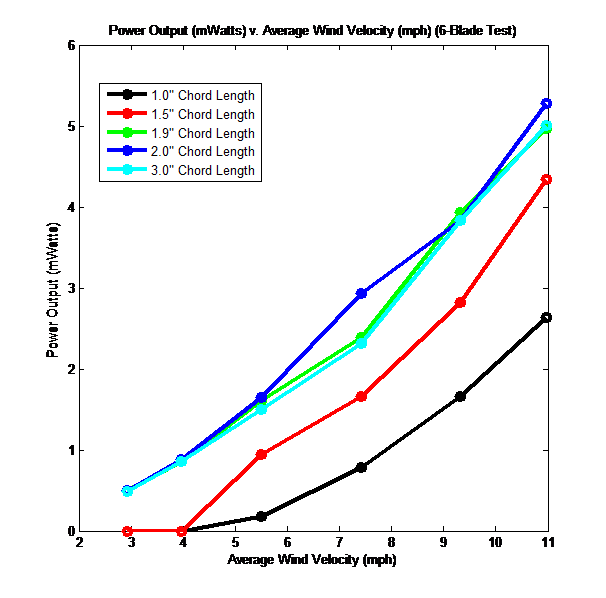
As is seen from the above curve the 1.0” and 1.5” chord length blades had trouble picking up the lower wind velocity due to the lack of sufficient surface needed to do so. The 1.9” and the 3.0” chord length blades have shown to be extremely similar in our test using six blades. We believe that it is too early to arrive at any conclusion for why this may be so due to the inability of these blades to reach a maximum. The 2.0” chord length blade has proven in this case to be the most effective but again it is too early to say that it will remain the most effective even at higher wind velocities.
Do Wind Turbines Really Have An Impact on Our Health?
December 3, 2012 at 4:55 pm
Keping Hua
Health Impact Blog
EK 132 Wind Energy
Prof. Grace
11/16/2012
Wind Energy, considered to have high potential and have already realized relatively low production costs compare to other sustainable energies.
However, it may be difficult to site wind turbines in some areas, due to the aesthetic or environmental reasons and might cause human health impact, such as noise, ice
throw and shadow flicker.
According to the residents of Wiittlesey, where a wind farm locates and impact by Ice-Tossing Turbine this winter, the ice that throwing by wind turbine smashed into a carpet showroom and a parking lot. However, the wind industry claims that the ice and snow are so heavy that would build up on the turbine and eventually, fall down and end up at places at the base of the turbine. They also claim that the turbines would not spin while so much ice on it, just as airplanes will not fly with too much ice on its wings.
Based a Swiss report last year, “Wind Turbine Ice Throw Studies in the Swiss Alps”, focused on turbines near ski places. The report states that ice throw is a “significant safety risk”, that the most dangerous place is under the wind turbine, only about 5 percent of ice landed more than 80 meters from the turbine.
According to the danger of ice throw, experts
recommend that wind farm developers should take ice throw into account as a safety issue while they were choosing the wind farm location. Another good way to avoid this unnecessary impact is to build “de-iced” prior to take off the ice and snow that build up on the turbine.
Wind turbine shadow flicker has the potential to induce photosensitive epilepsy; however the health risk is considered relatively small if proper planning of wind turbine’s location and direction.
Many data indicate that the three conditions that are necessary to cause the shadow flicker are: first, there
must be sun shine and no cloud cover; second, the blades have to facing
directly toward or away from the sun; third, the observer has to be close
enough to the object to be in its shadow.
First of all, there is very little chance to meet all three conditions
that are necessary to cause shadow flicker. Secondly, we can avoid shadow
flicker from happening by proper sitting of the wind turbine. So many experts hold that shadow flicker is
not the majority effects of health.
However, shadow flicker is still a safety concern, since it can distract driver if it’s locates by the road. In UK, wind turbine developer have been resolved the problem by shutting down turbines for the period during the day when shadow flicker is an issue.
Noise impact has been considered as the most serious issue compare to other health impact by wind turbine. Wind turbine is easily annoyance even at a low frequency. Many residents, who live around the wind farm area, complain that they could not rest and always awakened because of the
noise of wind turbine.
“I think it’s a great idea that all wind turbines are tested before they’re built or permitted,’’ said Eleanor Tillinghast, a steering committee member of Windwise Massachusetts. He states that “The problem is that the state’s testing doesn’t capture the infrasound, what you can’t hear, which is what’s affecting the body.’’
The turbine noise can be controlled by reducing the rotational speed of the blades or shut down after a certain time to avoid affecting the residents.
However, according to the chief executive of Fox Island Wind, George Baker, that turning down the turbines leads to an economic cost.
Even though the wind turbines have been caused some impact to human’s health. However, as a potentially excellent sustainable energy, by efficiently generate a great amount of energy with relatively low cost; wind energy is an indispensable second generation green energy. We can avoid those health impacts by carefully planning of location and the direction of blades. The simplest solution, suggests by Richard R.James, an acoustic expert, is that do not put the turbines so close to where people live.
Cite:
- GALBRAITH, KATE . "Green." Ice-Tossing
Turbines: Myth or Hazard?. The New York Times, 09 2008. Web. 28 Nov 2012. - Wahl, David , and Philippe Giguere. "GE
Energy." Ice Shedding and Ice Throw –. GE Energy Greenville, SC.
Web. 28 Nov 2012. - . "The Society for Wind Vigilance." Visual
Health Effects and Wind Turbines . N.p.. Web. 28 Nov 2012. - "Business Green." Study rejects
wind turbine "shadow flicker" fears. N.p., 16 2011. Web. 28 Nov
2012. - . "Blue Highlands Citizen Coalition
." Ice Throw. The Blue Highlands Citizens Coalition, n.d. Web. 28
Nov 2012. - . " ." Shadow Flicker. Nobel
Environmental Power. Web. 28 Nov 2012. - Abel , David Wind turbine noise is targeted.
The Boston Globe, 21 2012. Web. 28 Nov 2012. - ZELLER
Jr., TOM . "Energy & Environment ." For Those Near, the
Miserable Hum of Clean Energy. The New York Times, 5 2015. Web. 28 Nov
2012.
The Heart of Public Policy: The RPS
December 3, 2012 at 4:34 pm
What are Renewable Portfolio Standards?
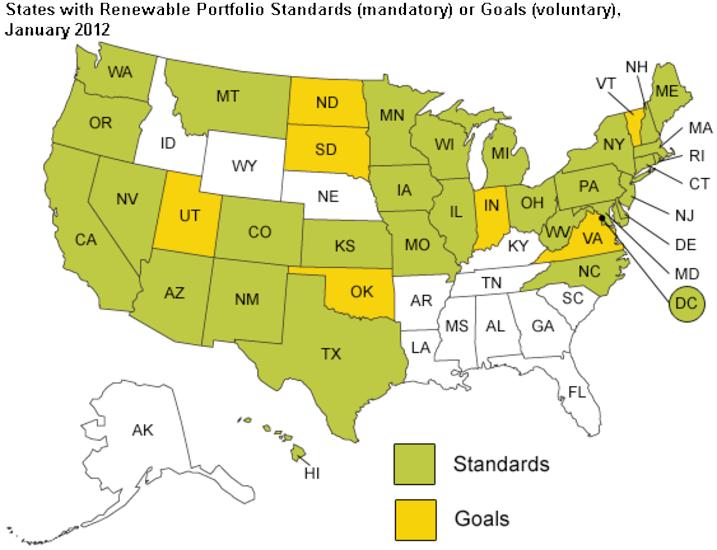
A Renewable Portfolio Standard (RPS), also known as Renewable Electricity Standard or a Renewable Energy Standard, places an obligation on electricity supply companies to source a specified proportion of their electricity sales from eligible renewable energy sources. These RPS programs were created to promote the development of renewable generation technologies such as wind, solar, biomass, landfill gas, and others in order to gradually decrease the dependence on non-renewable energy such as coal and natural gas. By forcing energy supply companies to source a given percentage of their sales from renewable sources, a market demand for that power is enhanced or created.[1]
In the USA, Renewable Portfolio Standard’s are assigned and regulated by the individual states. Most states with RPS programs have associated Renewable Energy Certificate (REC) trading programs. RECs provide a mechanism by which to track the amount of renewable power being sold and to financially reward eligible power producers. For each unit of power that an eligible producer generates, a certificate or credit is issued. These can then be sold either in conjunction with the underlying power or separately to energy supply companies. A market exists for RECs because energy supply companies are required to redeem certificates equal to their obligation under the RPS program. Some state programs, in order to promote specific renewable technology types, apply a credit multiplier by which a MWh of electricity produced by a particular technology receives more than one REC. For example, a wind multiplier of 3 means that one MWh of electricity produced with wind technology provides the producer of that electricity with 3 certificates.[1][2]
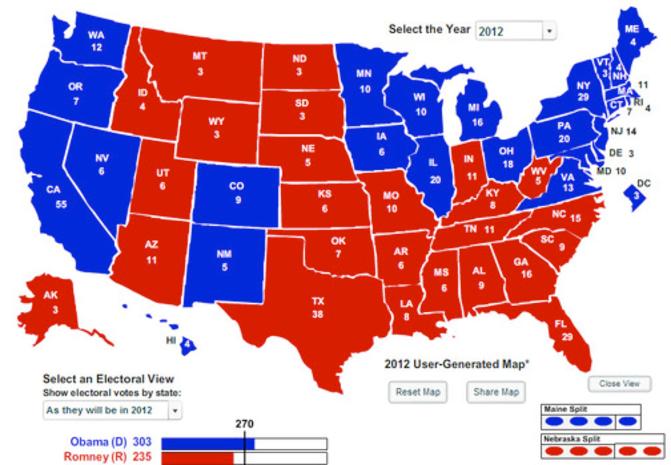
In the United States, 30 states (including D.C.) currently (as of January 2012) have mandatory renewable portfolio standards and 7 have renewable portfolio goals.[2] Thirteen states however have neither mandatory or goal renewable portfolio standards as is seen in Figure 1. I found it interesting to compare the map of the States with RPS’s to the electoral map of 2012. Interestingly enough I noticed that the states without any renewable portfolio standards or goals ended up being Republican states in this past election.
Figure 1.
http://www.eia.gov/todayinenergy/detail.cfm?id=4850
Figure 2.
http://www.examiner.com/article/an-updated-look-at-the-2012-electoral-college-map-with-polls-13
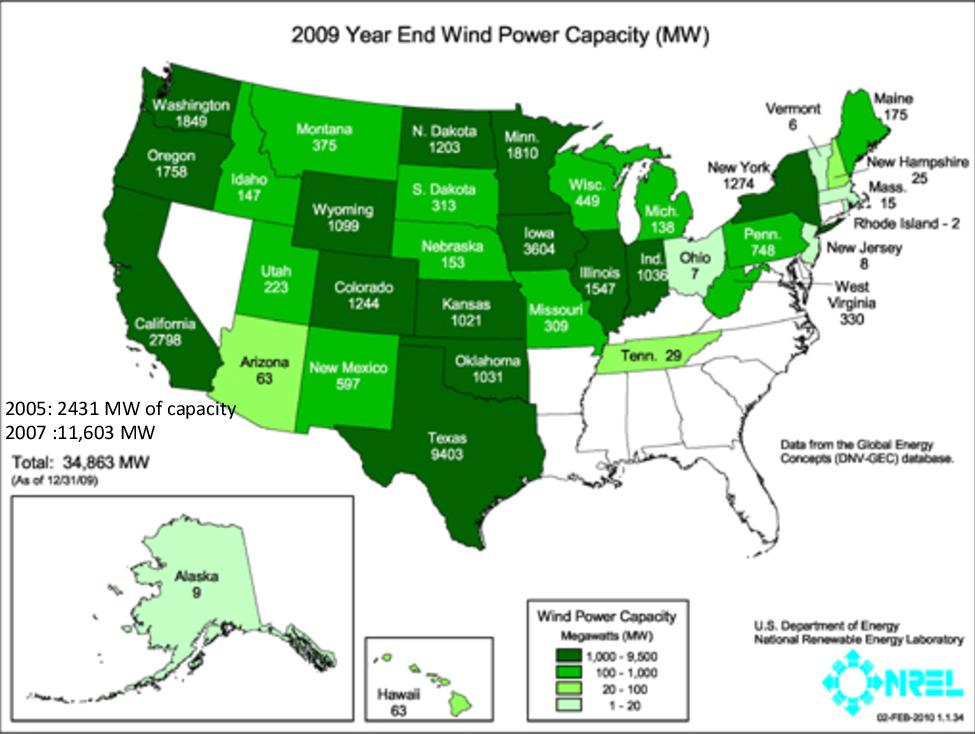
Figure 3.
http://www.windpoweringamerica.gov/pdfs/wind_maps/installed_capacity_2009.pdf
A few examples of wind energy values of various state’s RPS:
Texas: “The original standard calls for 2,000 megawatts (MW) of new renewable energy capacity, in addition to the 880 MW of existing renewable energy capacity, to be installed in Texas by 2009. In August 2005, the Texas legislature passed SB 20, which increased the new capacity requirement to 5,000 MW (with a goal of 500 MW from non-wind resources) by 2015, and set a goal of 10,000 MW by 2025.” [4] In 2005, Texas passed an RPS that would require that by 2015 4,500 MW of energy would have to be produced solely from wind energy. According to Figure 3 it is seen that Texas has almost quadrupled their energy standard requirement for 2009 of 2,000 MW and they have also almost reached their 2015 goal six years in advance.
Massachusetts: “The RPS specifies that 1 percent of electricity be generated from renewable sources in 2003, with the percentage increasing by 0.5 percent per year through 2009. Thereafter, the annual percentage increase is 1 percent per year, until suspended by the Massachusetts Division of Energy Resources (DOER).”[5] As of today Massachusetts produces 61 MW of wind energy and has set their goal to 2,000 MW of wind energy to be produced per year by 2020. [6]
New York: New York State has adopted an RPS plan called High Sheldon part of the controlling company Main Tier/Large Scale Generators. Through seven solicitations, the Main Tier has 56 active projects under contract totaling 1,842 MW of new renewable capacity. Main Tier projects include: 11 Landfill Gas Projects totaling 61.7 MW, 3 Biomass Projects totaling 74.3 MW, 25 Hydroelectric Projects totaling 51.3 MW, 17 Wind Projects totaling 1,654.2 MW. The power generated from these 56 projects is expected to provide enough clean power for nearly 683,000 homes per year. New York’s Renewable Portfolio Standard is significantly reliant upon wind energy making up about 89% of the 1,842 MW of new renewable capacity. [7][8]
International RPS example:
China: The government’s current plan calls for 300 GW of hydro-power, 150 GW of wind power, 30 GW of biomass power, and 20 GW of solar PV, for a total of 500 GW of renewable power capacity by 2020. This would be almost one-third of China’s expected total power capacity of 1600 GW by 2020. Wind power is the second most used source of renewable energy in China after hydro-power. [9]
I think that it is evident that public policy has a huge impact on the growth of wind energy as well as any other form of renewable energy. More specifically it is seen that an individual state’s Renewable Portfolio Standards and Goals whether they are mandatory or voluntary are one of the main reasons for the increase in the rate of reliance on renewable energy in a state as opposed to non-renewable energy resources such as coal and natural gas. Public Policy in the USA as well as in international countries play a significant role in the needed reform of energy sources.
Citations
- http://mjbeck.emtoolbox.com/?page=Renewable_Portfolio_Standards#Renewable
- http://mjbeck.emtoolbox.com/?page=Renewable_Portfolio_Standards#stateReportInfo
- www.eia.gov/todayinenergy/detail.cfm?id=8870
- www.ucsusa.org/assets/documents/clean_energy/texas.pdf
- http://www.mass.gov/eea/grants-and-tech-assistance/guidance-technical-assistance/agencies-and-divisions/doer/renewable-energy-snapshot.html
- http://www.mass.gov/eea/docs/doer/renewables/installed-solwind.pdf
- http://www.dsireusa.org/incentives/incentive.cfm?Incentive_Code=NY03R&re=0&ee=0
- http://www.nyserda.ny.gov/en/Program-Planning/Renewable-Portfolio-Standard.aspx#maintier
- http://www.renewableenergyworld.com/rea/news/article/2010/07/renewable-energy-policy-update-for-china