This blog revisits a posting from four years ago, in a series on Time to Change the Tax Discussion.
Whenever Congress (federal or state) proposes legislation that cuts taxes or increases net spending so that our national debt will increase, they should have to end every statement about why they favor their proposal with ...
Because I want our children and grandchildren to pay for it.
Even if congress or the executive branch won't say this, that is what they are doing.
The US House yesterday passed the American Health Care Act (AHCA) bill by a narrow margin that dramatically cuts taxes on the wealthy and raises burdens on the poor without even waiting for the CBO or others to calculate the impact on our total budget of this new trillion dollar proposal. The earlier AHCA bill was scored by the CBO as reducing the federal deficit, but doing so in a very painful, unfair way.
Since I have also urged people to think of bills in terms of their cost per household, not just in terms of billions and trillions of dollars, I present the numbers here as costs per US household (all 125 million of them).
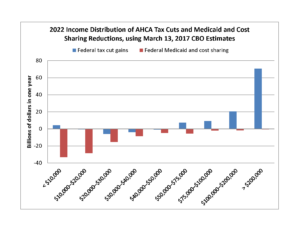
The March 13, 2017 CBO scoring of the previous, kinder, version of the AHCA projected that the bill would cut taxes in the amount of $900 billion over ten years, which is $7200 per US household. This is a huge wealth transfer, the majority of which go to the wealthy. The CBO cites Urban Institute researchers in their estimate that 70.6% of the tax cuts go to the 6% of households with incomes over $200,000. These cuts largely arise from eliminating the Medicare payroll tax rate for high-income taxpayers, the surtax on those taxpayers’ net investment income, and the annual fees imposed on health insurers. These tax cuts have virtually no effect on health care spending or the delivery system, but are a give-away to high income Americans, imposing burdens on our children and grandchildren. They are the preamble to the much larger tax cuts that president Trump proposed on April 26 in his one-page tax cut "proposal", which is a simplified version of his campaign proposal in 2015. Both tax cuts greatly increase the national debt by tens of thousands of dollars per household, yet have arguably received less attention in the media than the $2 per household cut in the Planned Parenthood budget (CBO, 2017 AHCA report, Table 2).
Offsetting these large tax cuts, the March 13 CBO rating of the AHCA projects that it will cut direct spending by $1,219 billion ($9,752 per household) over ten years. Unlike the tax cuts, which favor the wealthy, the spending cuts impact disproportionately the poor, the sick, and the old. The Urban Institute estimates that almost 77 percent of the federal funding losses come from families learning less than $30,000. So the bottom 36 percent of households is sacrificing $1000 of health support so that the top 6 percent of households can save an average of roughly $6,000 each.
Unlike the tax cuts for the wealthy, which will mostly increase savings and wealth, spending cuts on the poor directly affects their consumption spending, debt, and spending. The AHCA spending cuts will directly affect children since nearly half of them are close to poverty. We are not talking about making future children pay, but today's children.
The following figure, based on data in the CBO report on the AHCA, show how different the tax cuts are from the benefit decreases. the forecast was made by the Urban Institute for 2022, hence reflects the fully phased in impact of the changes.
The AHCA is being sold to the public as promoting growth (implausible when it comes out of current consumption), lowering premiums (the opposite of the CBO projections), and avoiding the "catastrophe of the ACA" (not the consensus view). Cutting the ACA subsidies and protections will force many not to buy health insurance, or to pay much more for their health care if they do. How can this stimulate the economy?
Taxes will never be attractive, but why should we LET THE CHILDREN AND GRANDCHILDREN PAY?