It is midnight. It worked. I just finished spending 3 hours making a rough analysis of the data. It actually worked. I have a lot to say but it is late.
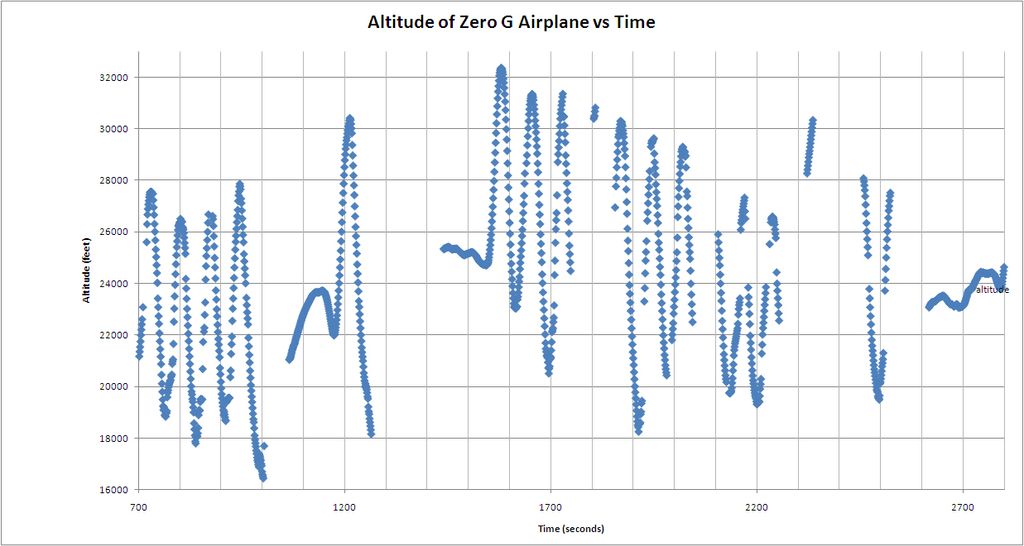
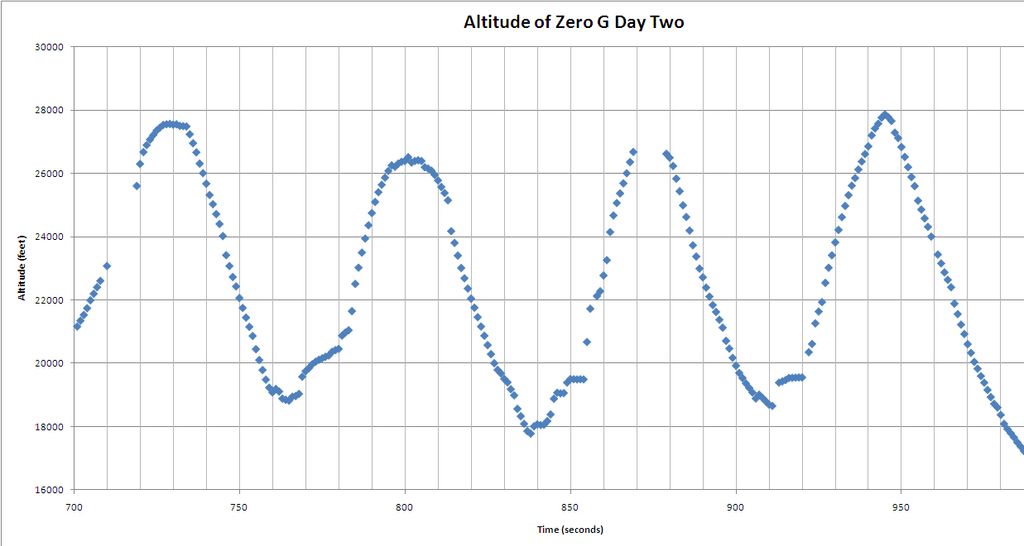
Laurie and Rose had an awesome flight today. Although the video camera failed (probably because the team leader neglected to put fresh batteries in the camera), the GPS sensor worked. I made a crude graph of the altitude data. Here you can see the altitude as a function of time.
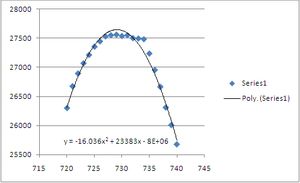
Even cooler, if you do a quadratic fit on the parabolas, you get either plus or minus 16 feet/sec/sec which is half the acceleration due to gravity (which is what the pilot needs to achieve). Way cool.
So many thanks to Laurie and Rose for gathering the GPS data.
I looked at the data from our low g accelerometer. I don’t trust the numbers, as the sensor was not well calibrated. But it does give a good sense of where the low and high g parts of the flight are. But from the pendulum sensor during the last several parabolas, I was able to obtain the period and acceleration. Even better, they comply with theory. Seeing this next graph at midnight. Physics actually works. This trip to Texas was worth it.
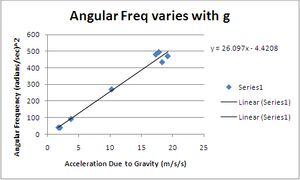
So the first two data points (almost overlapping) are lunar gravity at about 1.8 m/s/s. The next data point is Martian gravity at about 3.7 m/s/s. Then one point of near Earth gravity at 10.3 m/s/s, followed by several points of hyper gravity ranging from 17 to 20 m/s/s. As you can see from the above graph, there is a linear relationship between the acceleration due to gravity and the angular frequency squared of the pendulum. Wow. So cool.

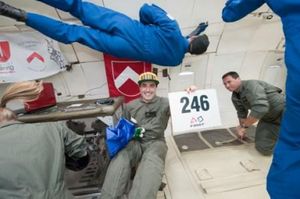
A lot more to say about the personal experience, but that can wait until tomorrow. There are photos on the web. I will post them tomorrow night. I will just add this one photo. Go Bruins and Team 246!