My research is focused around infrared spectra of Jupiter’s upper atmosphere taken with the NIRSPEC instrument at Keck Observatory. Within these spectra are emissions from the dominant molecular ion in Jupiter’s upper atmosphere, H₃⁺, and I calculate temperatures and densities from these emissions with the help of a Python module called h3ppy (like happy)! H₃⁺ is an especially nice molecule to observe thanks to its prevalence in the upper atmospheres of the giant planets and tendency to emit in regions of methane absorption (resulting in bright emission lines on a dark background).
h3ppy derives temperatures and densities from the magnitude ratios of H₃⁺ emission line peaks, and with it, I map these temperatures and ion densities all over Jupiter. This will help determine how the environment in Jupiter’s upper atmosphere varies temporally and spatially (latitude and longitude)!
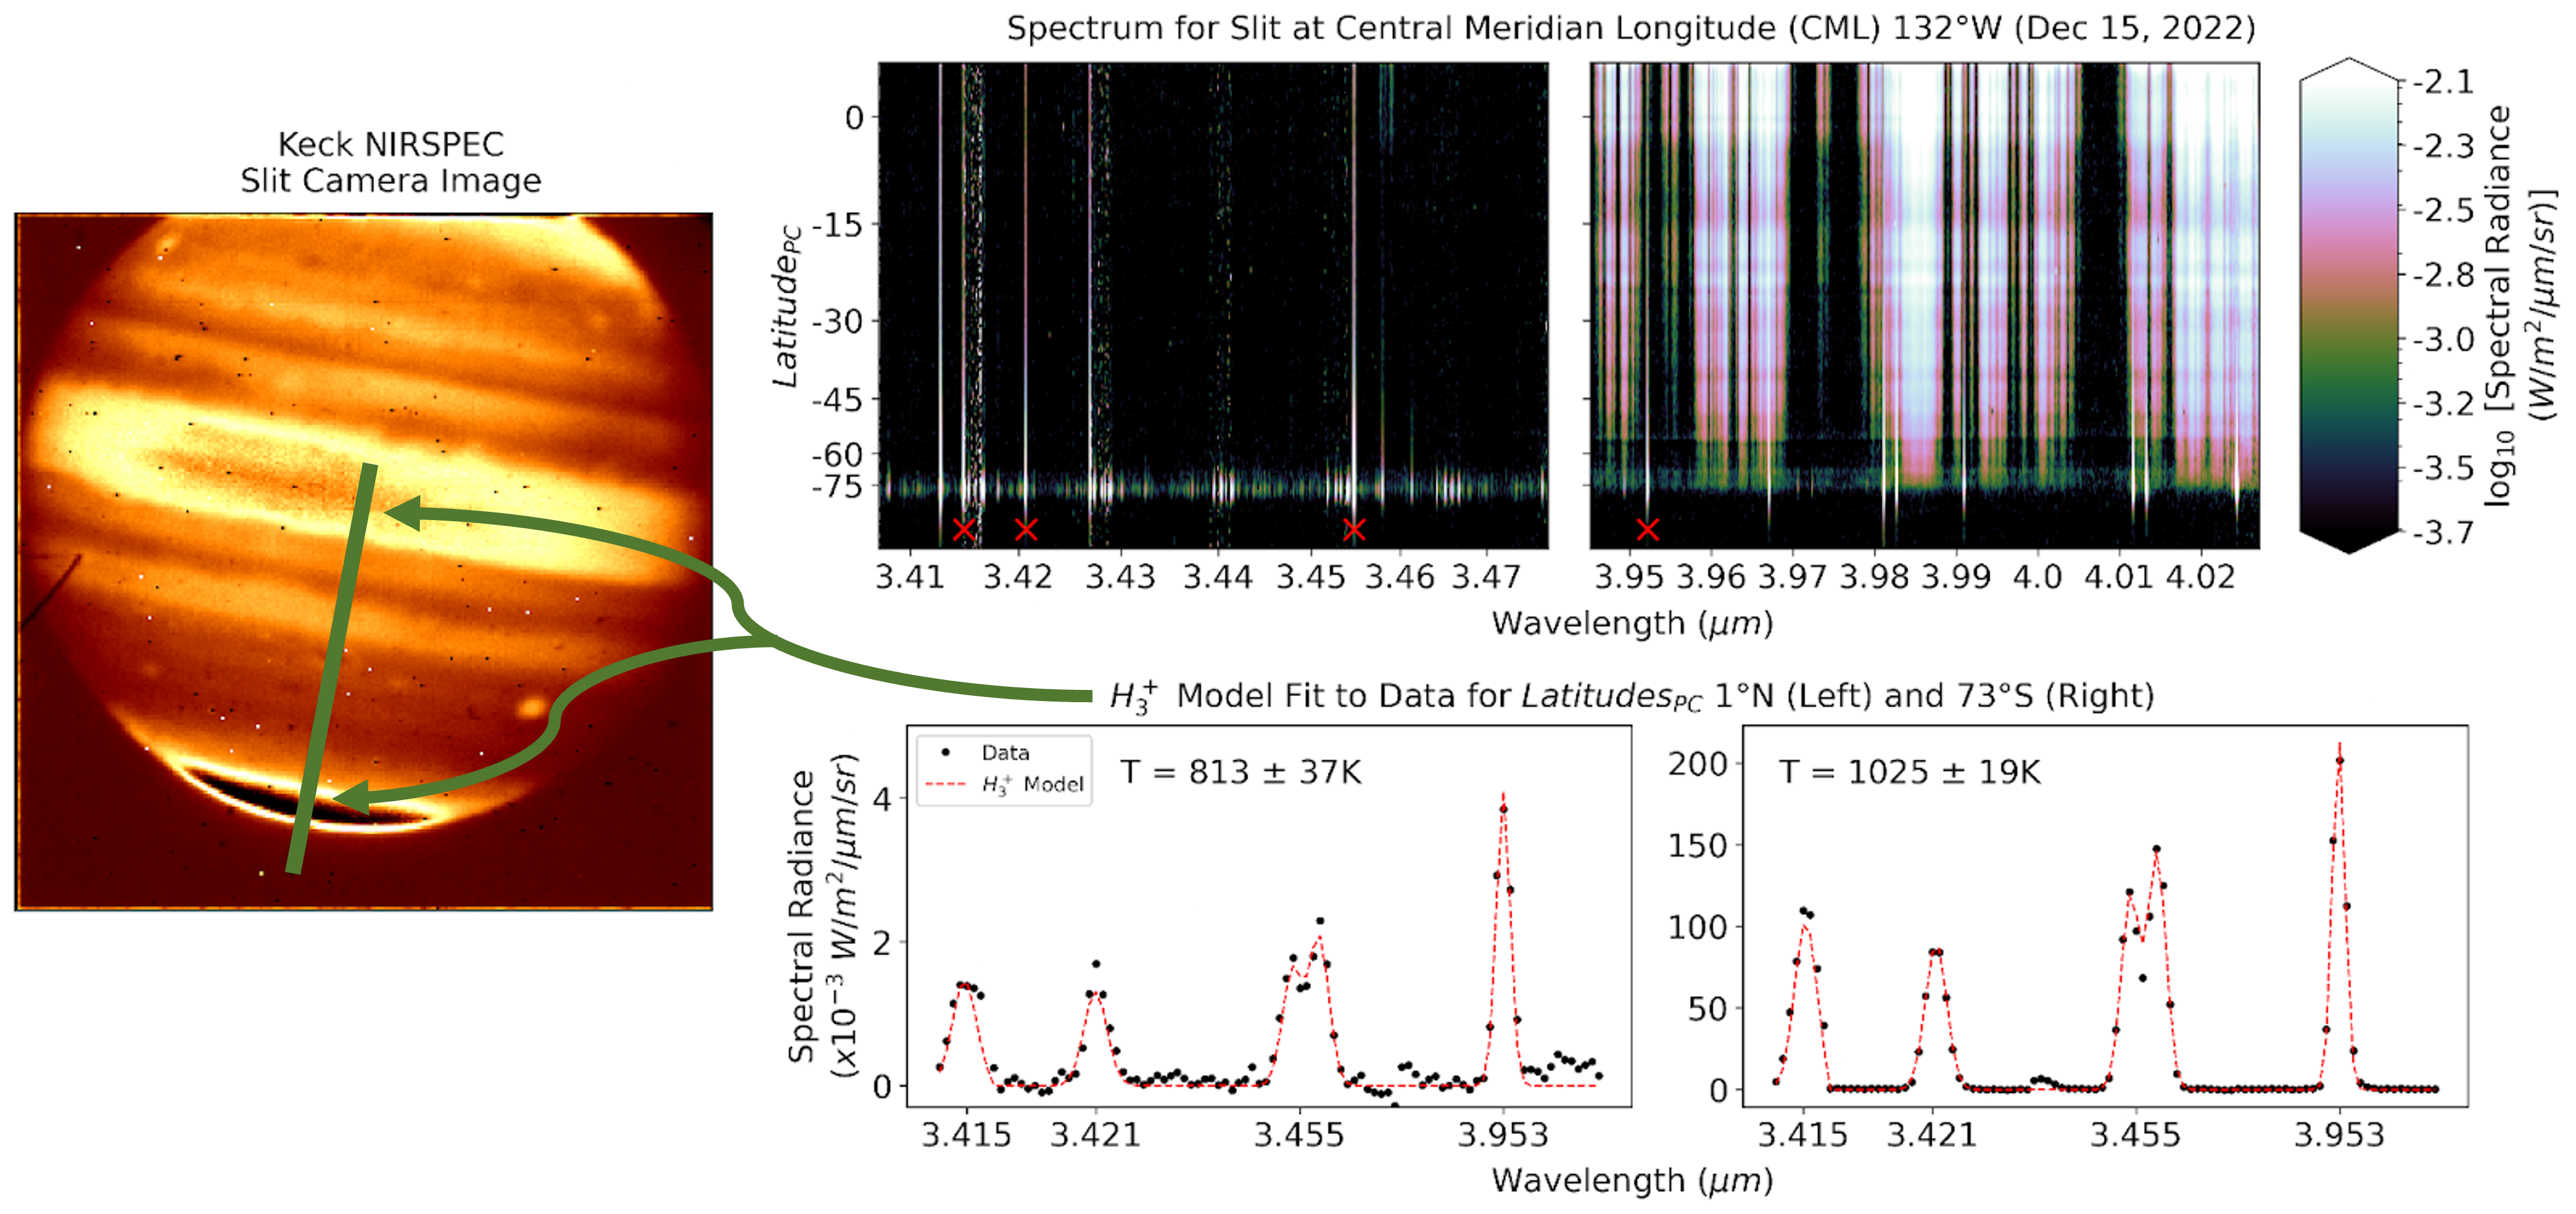 Above figure: Example of the results of calculating temperatures from a single spectrum. Each pixel in the slit (the green line cutting through the planet on the left) has a corresponding spectrum (such as the image in the upper right where each row is an individual spectrum), and thus its temperature and density can be derived using an H₃⁺ model. The fit from h3ppy is shown on the bottom right; specific emissions have been cropped from the wider spectrum (each marked with a red X in the top of the image) for input into the model. These individual fits map to specific longitudes and latitudes on Jupiter—the two examples on the bottom right are at positions of 1°N, 132°W and 73°S, 132°W.
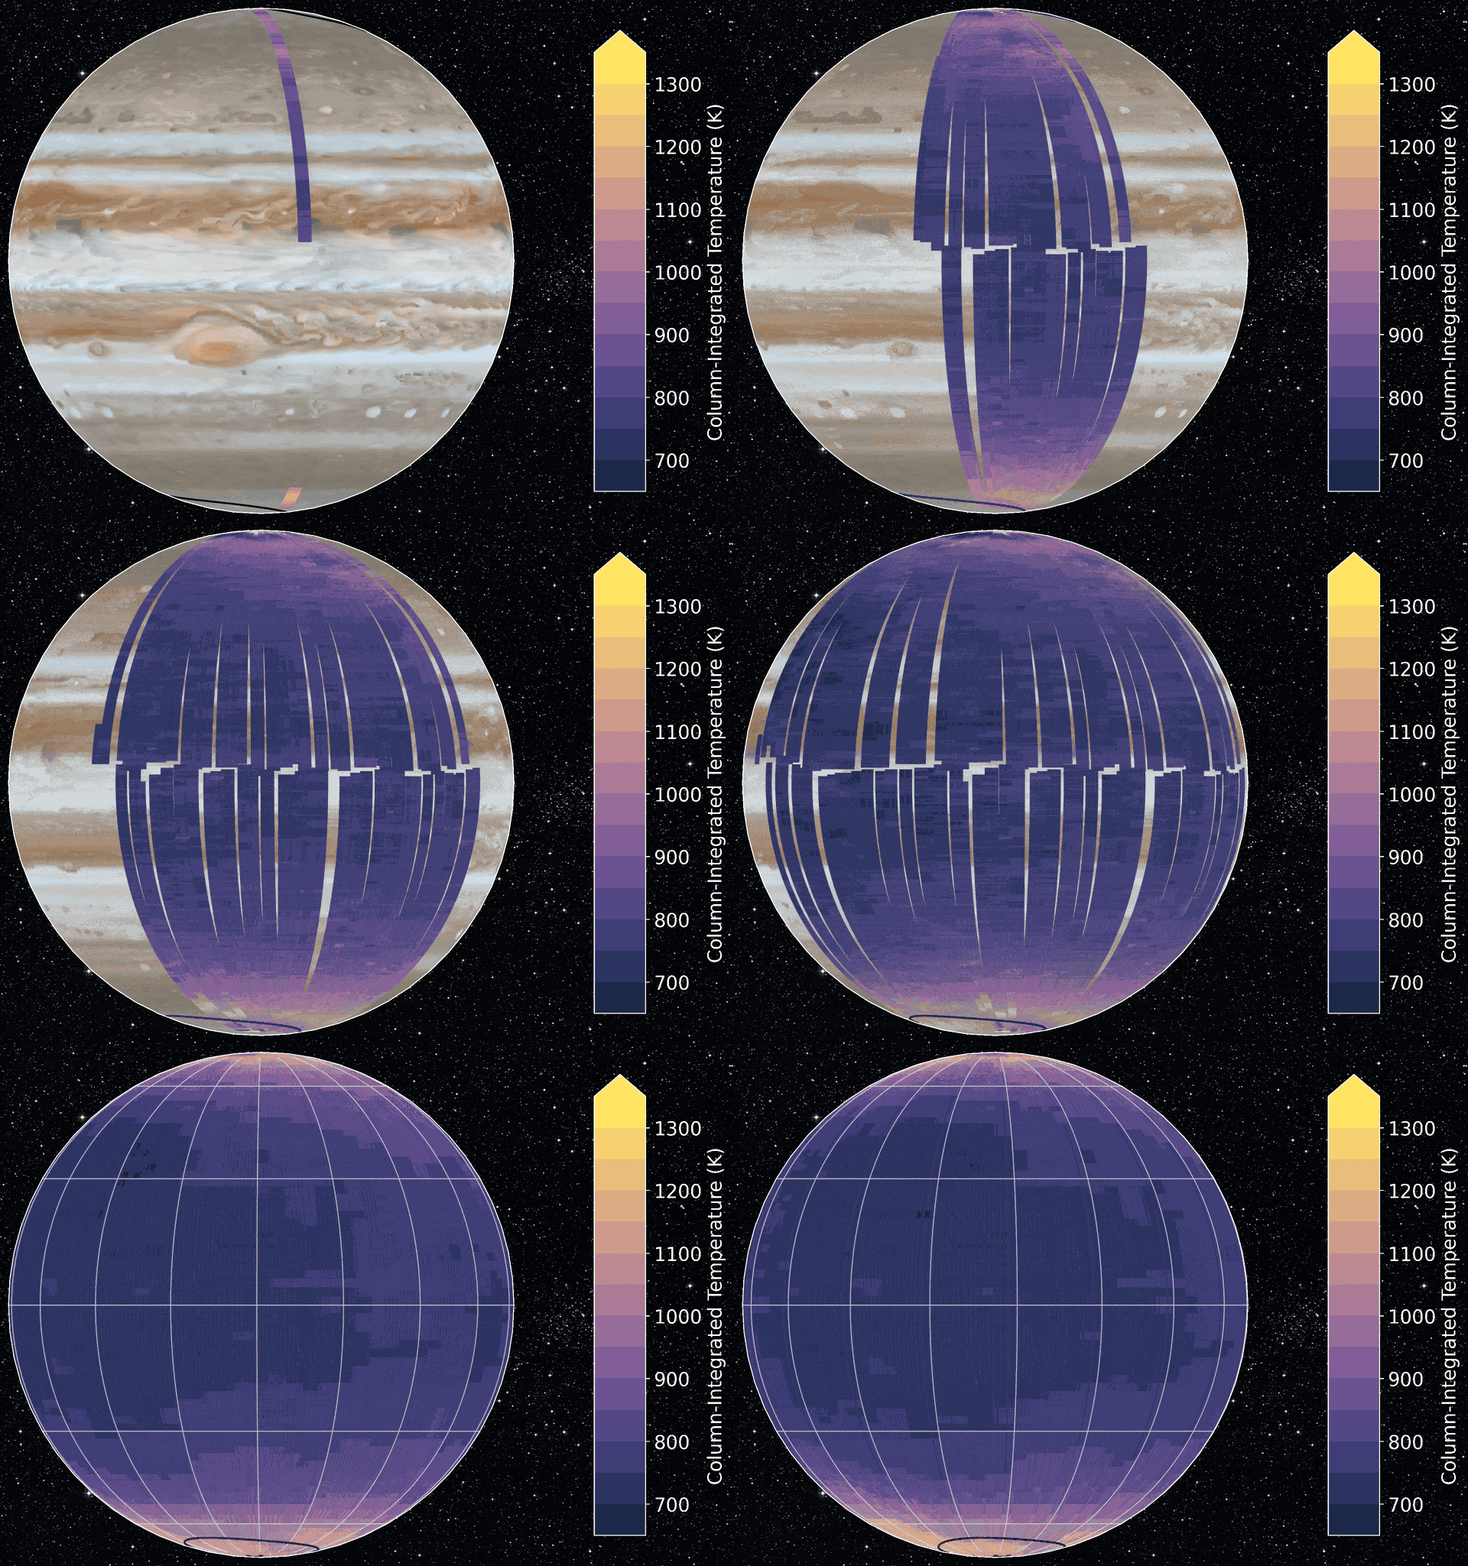
Below figure: temperatures mapped for 3 nights in 2022 and 2023. These nights overlap significantly in longitude and provide helpful comparisons for how temperature can vary on short (~1 month) and long (~1 year) timespans. Further details about these maps are available in my first paper, published in Planetary Science Journal.

My second paper, published in the Astrophysical Journal Letters, expands from the initial ~30,000 temperature measurements to >175,000 temperatures and H₃⁺ densities, presents unprecedented global coverage, and finds an unexpectedly stable system over long time spans (years to decades)! Highlights from Figure 1 (below) include: (a) global evidence in favor of redistributed auroral energy heating the low latitudes as a solution to our 50-year “energy crisis”, (b) a reconstruction of the morphology observed by filtered images of H₃⁺ emission (Stallard et al. 2018, images taken from 1995-2000) in its density (consistent over months, years, & decades), and (c) the first global estimate on H₃⁺ radiance (at local noon) that finds the majority of emitted energy is contributed by the low latitudes.
I am currently focusing on on the short term variability we observe over days-long timespans, rather than viewing the entire dataset homogenously (as in my second paper). This is to understand how significantly low latitude temperatures can change over consecutive nights of observations (including a severe magnetospheric compression event in October 2024, published in Wilson et al. 2026) and whether those changes can be attributed to variable auroral temperatures. Additionally, I am looking into longitudinal temperature structure and variability in the aurora, checking for longitudinal temperature structure along the latitude path of the Io footprint, and putting the first constraints on the magnitude of nonauroral neutral wind variability via the changing morphology of H₃⁺ densities throughout our nights of observation. Keep an eye out for “Short-term and localized variability in Jupiter’s upper atmosphere”, coming to a journal near you (hopefully in the next few months).
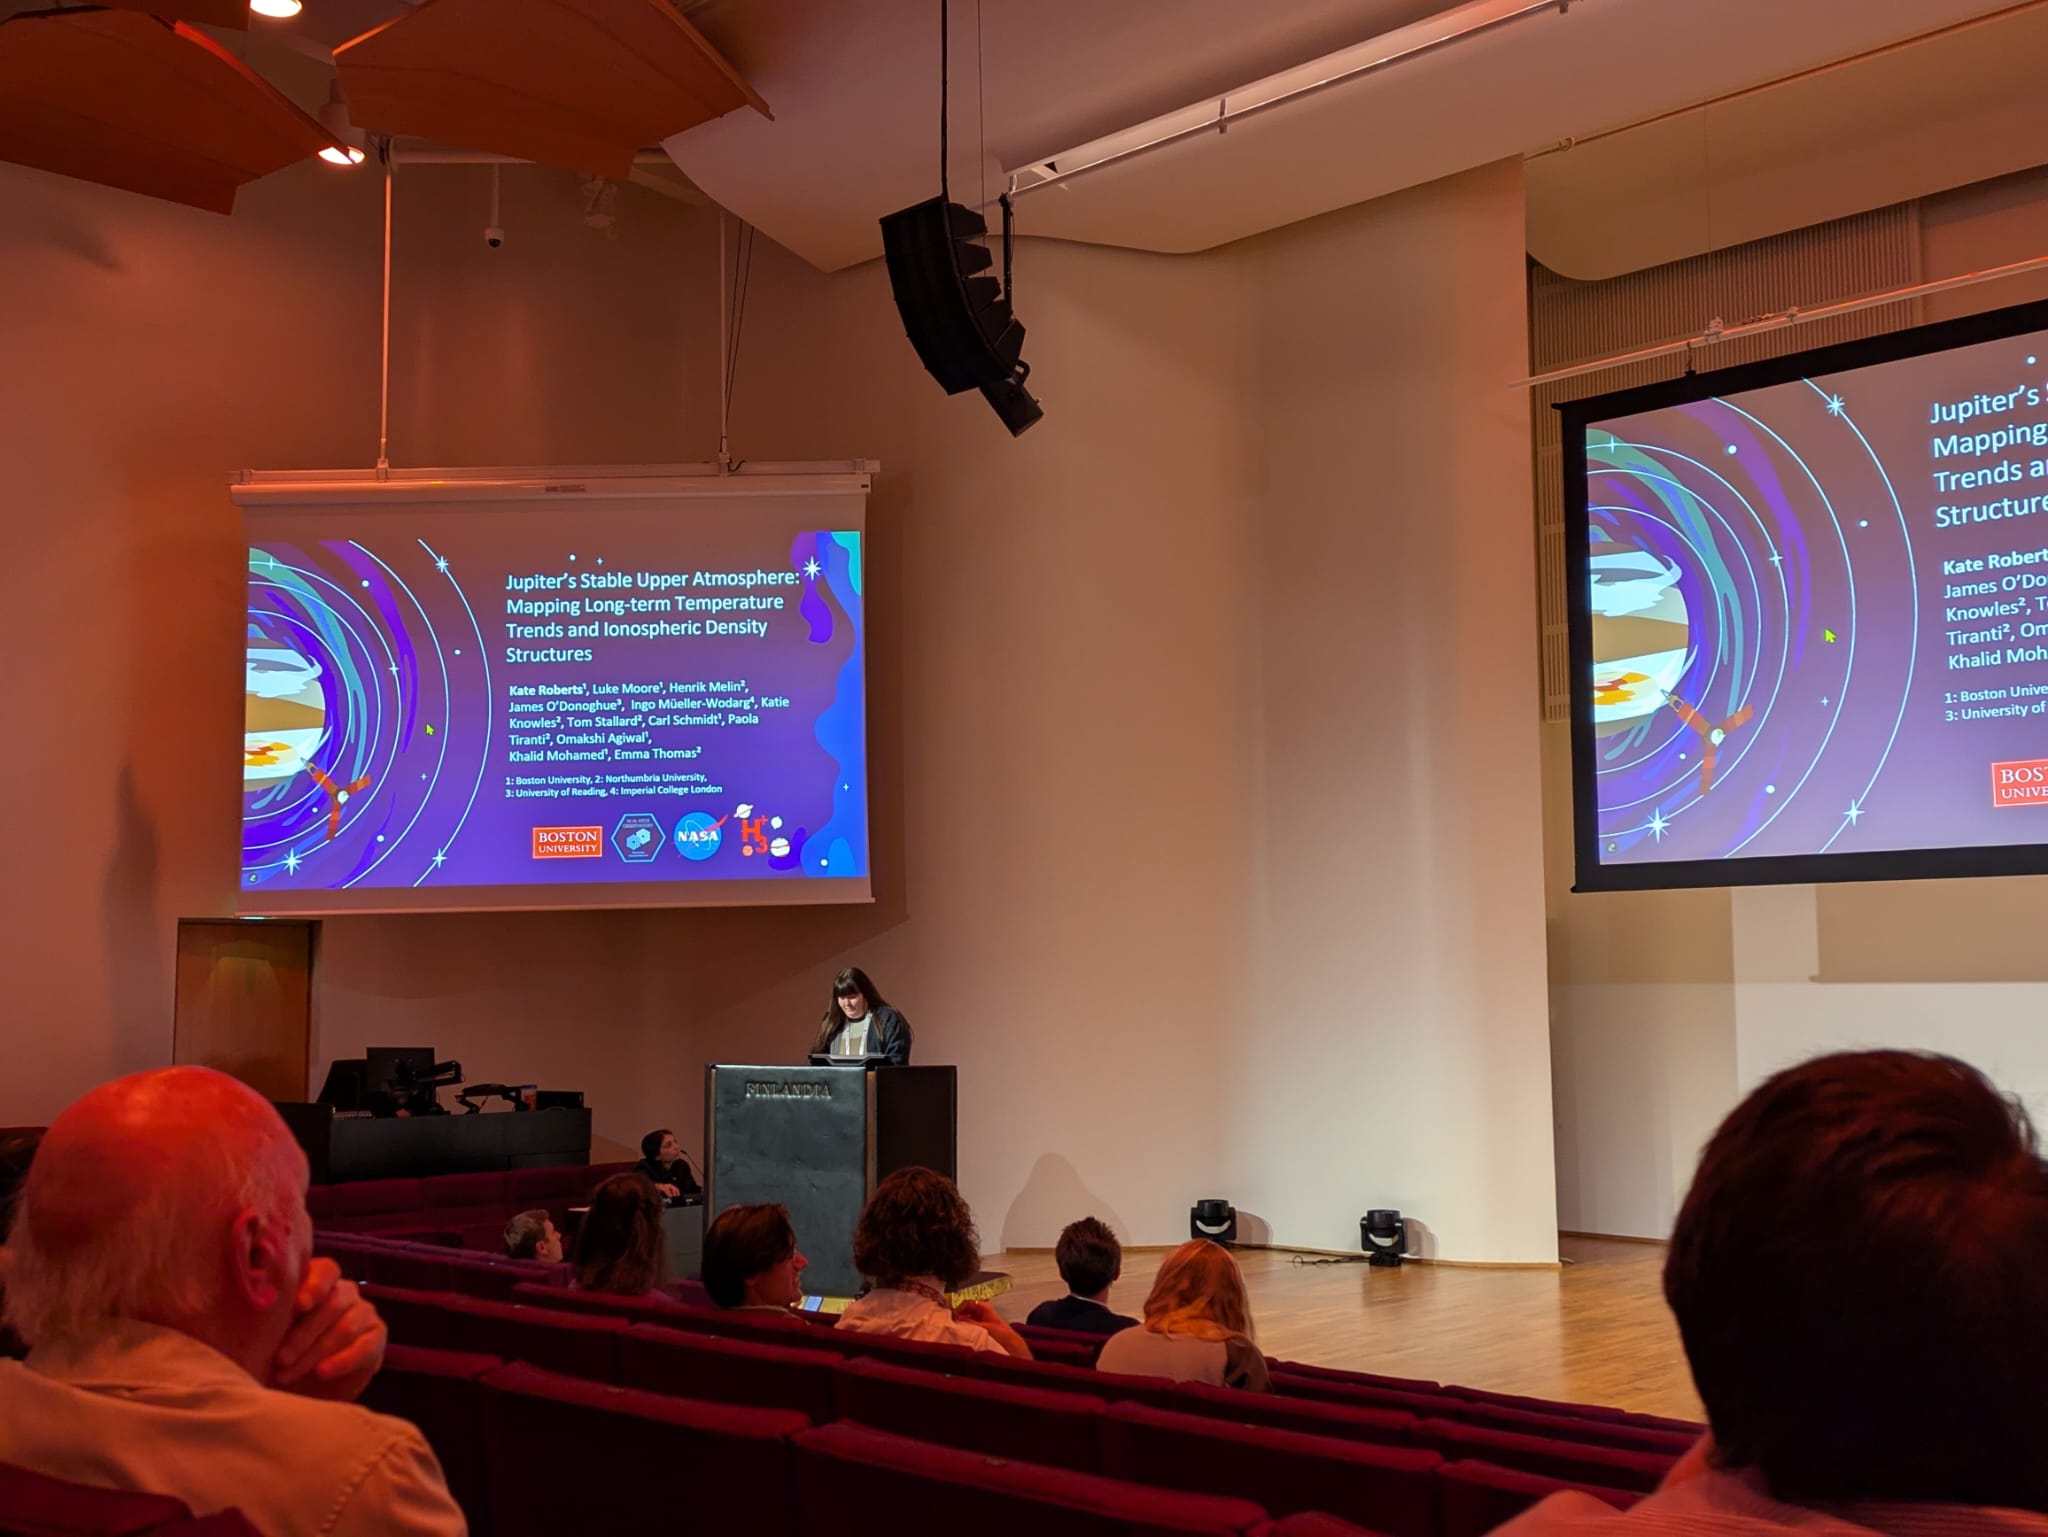
(Here’s a short article my undergrad did about me and my research!)