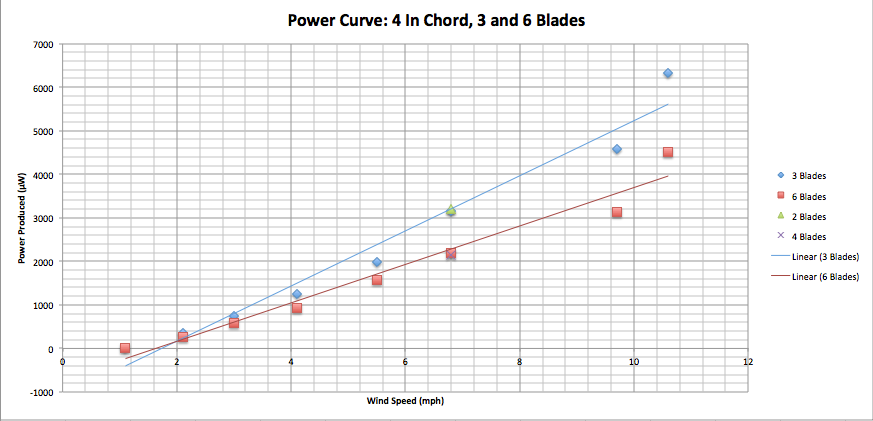
My group obtained similar data on the number of blades data. It’s interesting that less blades gives more power!
Adam Tortolanni
posted on October 9, 2012 at 3:14 pm
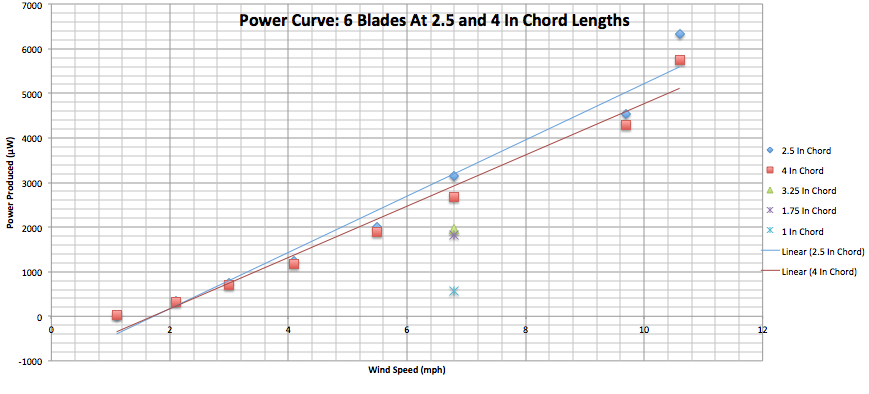
Blades are rectangular with one curved corner. Blades are 7 inches long and of chord lengths 1, 1.75, 2.5, 3.23, and 4 inches.
yisong
posted on October 9, 2012 at 3:20 pm
It was expected for power to increase proportionally with the wind speed. However, I had no clue how different chord length and number of blades would affect the wind speed. Through this experiment, I learned that chords do not necessarily have to be big or small in order to earn more power because high power points appeared to be with 2.5 inch (around the middle) chord. It was similar with the number of blades. 3 blades seem to be the perfect combination for the maximum power; more blades do not help in producing more power.
mleeza
posted on October 9, 2012 at 3:46 pm
Before we tested to generate a power curve for the different number of blades and chord lengths, we tested the blades at one constant speed (80 volts). This data is not represented in a graph, however it did allow us to draw conclusions about how the turbines behaved in comparison to one another. For example, by looking at our gathered data for the chord length 2.5 inches, we compared how it performed with 2, 3, 4 and 6 blades at the constant wind speed. From this we learned that both 3 and 4 blades performed the best. Unfortunately, the data we gathered this way was kind of all over the place and hard to draw finite conclusions from; the outcomes differed, with the 1 inch chord performing the best with 6 blades, the 1.75 and 4 inch chords excelling with 2 blades, and the 3.25 inch chord doing best at 4 blades. I think the power curves we did later (shown above) show more clearly that 3 blades is the best for generating power, however I wish we had more time to test this theory by creating a power curve for several other chord lengths to see how the energy is effected by number of blades.
swanson3
posted on October 9, 2012 at 3:57 pm
It is surprising to see that in our second test, the 3 bladed turbine had a higher power curve than the 6 bladed turbine. According to the power curves that were shown to us in the beginning of the semester, an increase in blade number should have resulted in an increase in power. While an increase in blade numbers past about 3 blades did not see a significant increase in power, it was increase nonetheless. That is why this bit of data is so surprising. What could be different about our testing that could have caused this inverse data? All elements other than blade number were controlled, so any reason for this difference must be with the building of our turbine. Perhaps it was the materials that made a difference?
mschu5
posted on October 9, 2012 at 9:05 pm
From looking at our power curves and comparing them to the power curves that we were shown, it seems that three blades created the most power instead of the expected six blades. This must mean that the shape of our blades played some factor in the speed the blade turned. Also, there was not much space between the blades when we used six. This may also be a reason for why they did not produce as much power as the more spaced out three blades. As for the chord widths of our blades, four inch widths created more power up to 60V but then the 2.5 inch blades produced more power at speeds higher than 60V. From this data, a wind turbine company could see that it would be smarter to make the chord width shorter if the turbines are placed in a geographical area that experiences high speed wind. Vice versa, a company should make their chords thicker if the turbine is in an area that has lower wind average wind speeds.
adamjt
posted on October 10, 2012 at 4:21 pm
Graphs were updated to final units: μW versus mph.

7 Comments
cjfowler posted on October 9, 2012 at 3:11 pm
My group obtained similar data on the number of blades data. It’s interesting that less blades gives more power!
Adam Tortolanni posted on October 9, 2012 at 3:14 pm
Blades are rectangular with one curved corner. Blades are 7 inches long and of chord lengths 1, 1.75, 2.5, 3.23, and 4 inches.
yisong posted on October 9, 2012 at 3:20 pm
It was expected for power to increase proportionally with the wind speed. However, I had no clue how different chord length and number of blades would affect the wind speed. Through this experiment, I learned that chords do not necessarily have to be big or small in order to earn more power because high power points appeared to be with 2.5 inch (around the middle) chord. It was similar with the number of blades. 3 blades seem to be the perfect combination for the maximum power; more blades do not help in producing more power.
mleeza posted on October 9, 2012 at 3:46 pm
Before we tested to generate a power curve for the different number of blades and chord lengths, we tested the blades at one constant speed (80 volts). This data is not represented in a graph, however it did allow us to draw conclusions about how the turbines behaved in comparison to one another. For example, by looking at our gathered data for the chord length 2.5 inches, we compared how it performed with 2, 3, 4 and 6 blades at the constant wind speed. From this we learned that both 3 and 4 blades performed the best. Unfortunately, the data we gathered this way was kind of all over the place and hard to draw finite conclusions from; the outcomes differed, with the 1 inch chord performing the best with 6 blades, the 1.75 and 4 inch chords excelling with 2 blades, and the 3.25 inch chord doing best at 4 blades. I think the power curves we did later (shown above) show more clearly that 3 blades is the best for generating power, however I wish we had more time to test this theory by creating a power curve for several other chord lengths to see how the energy is effected by number of blades.
swanson3 posted on October 9, 2012 at 3:57 pm
It is surprising to see that in our second test, the 3 bladed turbine had a higher power curve than the 6 bladed turbine. According to the power curves that were shown to us in the beginning of the semester, an increase in blade number should have resulted in an increase in power. While an increase in blade numbers past about 3 blades did not see a significant increase in power, it was increase nonetheless. That is why this bit of data is so surprising. What could be different about our testing that could have caused this inverse data? All elements other than blade number were controlled, so any reason for this difference must be with the building of our turbine. Perhaps it was the materials that made a difference?
mschu5 posted on October 9, 2012 at 9:05 pm
From looking at our power curves and comparing them to the power curves that we were shown, it seems that three blades created the most power instead of the expected six blades. This must mean that the shape of our blades played some factor in the speed the blade turned. Also, there was not much space between the blades when we used six. This may also be a reason for why they did not produce as much power as the more spaced out three blades. As for the chord widths of our blades, four inch widths created more power up to 60V but then the 2.5 inch blades produced more power at speeds higher than 60V. From this data, a wind turbine company could see that it would be smarter to make the chord width shorter if the turbines are placed in a geographical area that experiences high speed wind. Vice versa, a company should make their chords thicker if the turbine is in an area that has lower wind average wind speeds.
adamjt posted on October 10, 2012 at 4:21 pm
Graphs were updated to final units: μW versus mph.