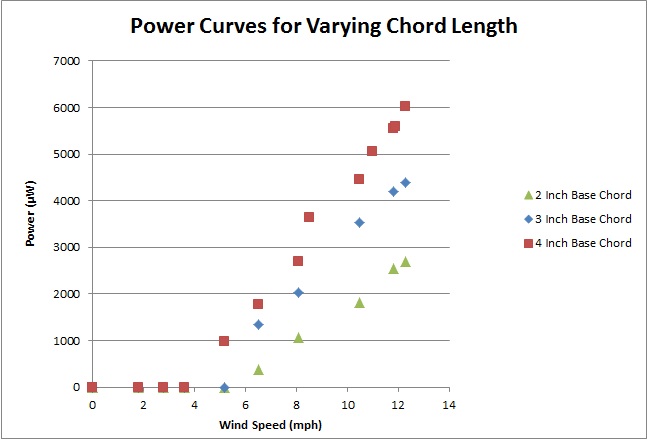
Figure 1: Power Curve
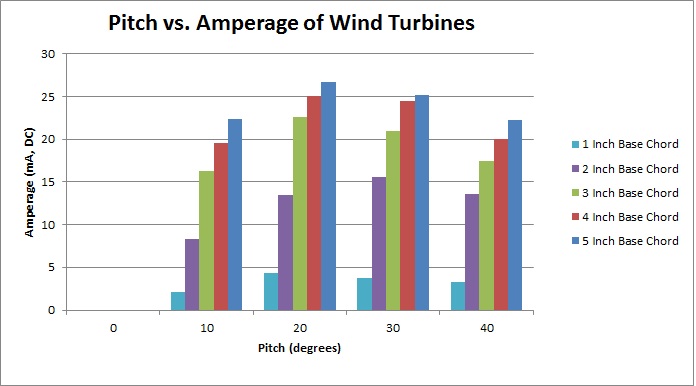
Figure 2: Pitch vs. Amperage (8.3 mph)
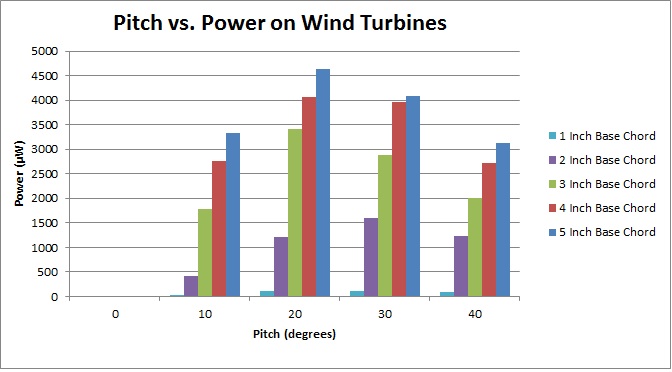
Figure 3: Pitch vs. Power (8.3 mph)
Notes from group:
The design for our blade was a triangle, in which the height of the triangle is 7 inches and the base width would change between 1 inch and 5 inches. We originally tested the blades at 8.3 mph and varied pitch, as shown by the latter two graphs. Due to the constraint of time, we had to retest for comparing wind speed vs. power at varying base chord lengths. It is clear that increasing the chord length increases power overall, generating the most power at any wind speed when the chord length is 4 inches. The greatest amperage generated at 20 degrees of pitch, and slowly decreases overall for pitch greater than 20 degrees. There is a similar effect for the power generated, increasing dramatically at 10 degrees and having overall maximum at 20 degrees of pitch, and then slowly decreasing beyond 20 degrees of pitch. However, the 2 inch base chord showed a maximum at 30 degrees rather than 20 degrees, which differs from the behavior of the other chord length. It could be possible that for that length it is more optimal to have a higher pitch, or it could be a result of human error since the measured pitch isn’t completely precise.