Reposting from The Incidental Economist Blog
What happened to US life expectancy?
Posted: 07 Jan 2014 03:00 AM PST
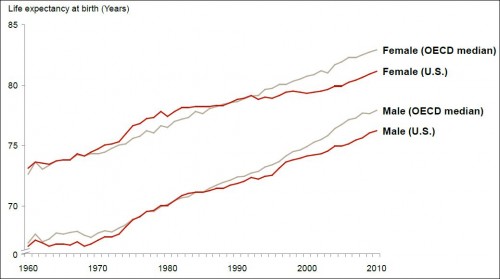
Here’s another chart from the JAMA study “The Anatomy of Health Care in the United States”:
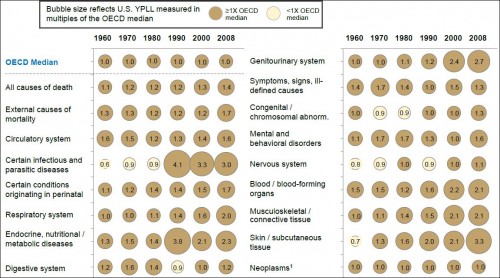
Why did the US fall behind the OECD median in the mid-1980s for men and the early 1990s for women? Note, the answer need not point to the health system. But, if it does, it’s not the first chart to show things going awry with it around that time. Before I quote the authors’ answer, here’s a related chart from the paper:
The chart shows years of potential life lost in the US as a multiple of the OECD median and over time. Values greater than 1 are bad (for the US). There are plenty of those. A value of exactly 1 would mean the US is at the OECD median. Below one would indicate we’re doing better. There’s not many of those.
It’d be somewhat comforting if the US at least showed improvement over time. But, by and large, it does not. For many conditions, you can see the US pulling away from the OECD countries beginning in/around 1980 or 1990, as was the case for life expectancy shown above. Why?
The authors’ answer:
Possible causes of this departure from international norms were highlighted in a 2013 Institute of Medicine report and have been ascribed to many factors, only some of which are attributed to medical care financing or delivery. These include differences in cultural norms that affect healthy behaviors (gun ownership, unprotected sex, drug use, seat belts), obesity, and risk of trauma. Others are directly or indirectly attributable to differences in care, such as delays in treatment due to lack of insurance and fragmentation of care between different physicians and hospitals. Some have also suggested that unfavorable US performance is explained by higher risk of iatrogenic disease, drug toxicity, hospital-acquired infection, and a cultural preference to “do more,” with a bias toward new technology, for which risks are understated and benefits are unknown. However, the breadth and consistency of the US underperformance across disease categories suggests that the United States pays a penalty for its extreme fragmentation, financial incentives that favor procedures over comprehensive longitudinal care, and absence of organizational strategy at the individual system level. [Link added.]
This is deeply unsatisfying, though it may be the best explanation available. Nevertheless, the sentence in bold is purely speculative. One must admit that it is plausible that fragmentation, incentives for procedures, and lack of organizational strategy could play a role in poor health outcomes in the US — they certainly don’t help — but the authors have also ticked off other factors. Which, if any, dominate? It’s completely unclear.
Apart from the explanation or lack thereof, I also wonder how much welfare has been lost relative to the counterfactual that the US kept pace with the OECD in life expectancy and health spending. It’s got to be enormous unless there are offsetting gains in areas of life other than longevity and physical well-being. For example, if lifestyle is a major contributing factor, perhaps doing and eating what we want (to the extent we’re making choices) is more valuable than lower mortality and morbidity. (I doubt it, but that’s my speculation/opinion.)
(I’ve raised some questions in this post. Feel free to email me with answers, if you have any.)

