Students: Embedding Instagram, Twitter posts into a WordPress post : Here’s what it will look like

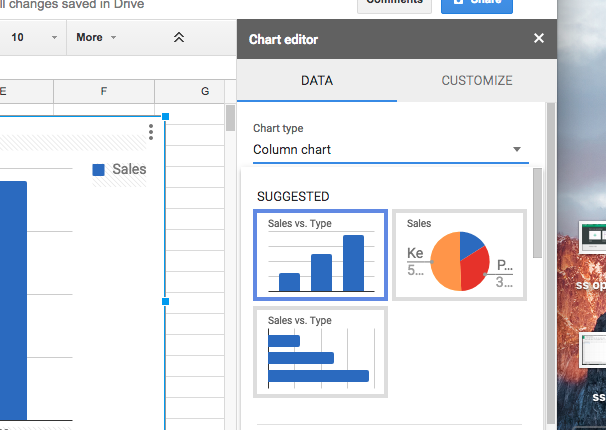
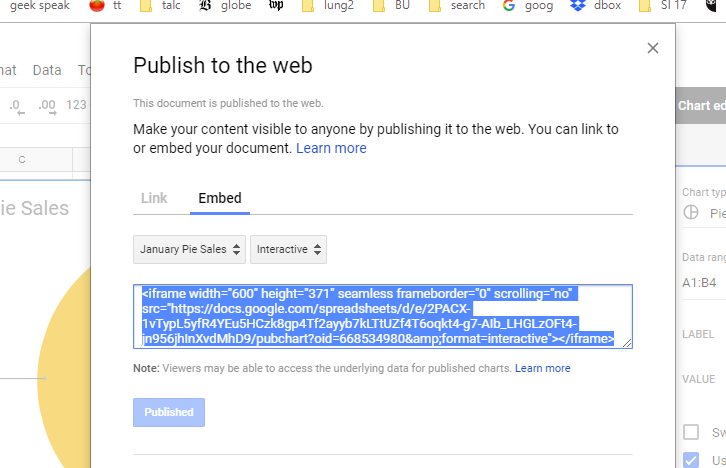
URL or embed code will work.  Be sure to  use the “text” or “html” tab at the top for the embed code. URL seems to work with either tab


View this post on Instagram

Este video lo grabamos hace un mes atrás y hoy es un día especial para publicarlo por que te vas a Argentina por un tiempo, siempre nos divertimos tanto y lo más hermoso es que compartimos juntas esta pasión del baile…buen viaje y vuelve pronto hermanita te amo mucho!! ❤️🙏 . . We filmed this video one month ago and today is a special day to post it because you’re going to Argentina for a little bit, we always had so much fun and the beautiful thing is that we shared together our passion of dance…good trip and come soon sister love you so much!! ——————————————- Choreography : @tuli_acosta 🔥 . . Dancers: @tuli_acosta @isidora_dancer 💃 . . Song: Miss you by @cashmerecat / @majorlazer / @torylanez 🎤 . . Filmed: @karinnmarco 🎥

A post shared by Isidora Villagra (@isidora_dancer) on Oct 2, 2018 at 5:00am PDT


You need to use the “text” or “html” tab at the top, or it will look like this. Don’t use the visual tab unless you want it to look like this
<blockquote class=”instagram-media” data-instgrm-captioned=”” data-instgrm-permalink=”https://www.instagram.com/p/BobhAWuDGSb/?utm_source=ig_embed&amp;utm_medium=loading” data-instgrm-version=”12″ style=”background: #FFF; border: 0; border-radius: 3px; box-shadow: 0 0 1px 0 rgba(0,0,0,0.5),0 1px 10px 0 rgba(0,0,0,0.15); margin: 1px; max-width: 540px; min-width: 326px; padding: 0; width: calc(100% – 2px);”>
<div style=”padding: 16px;”><a href=”https://www.instagram.com/p/BobhAWuDGSb/?utm_source=ig_embed&amp;utm_medium=loading” style=”background: #FFFFFF; line-height: 0; padding: 0 0; text-align: center; text-decoration: none; width: 100%;” target=”_blank”>
margin: 8px 0 0 0; padding: 0 4px;”><a together our passion of da…44340126766239749?ref_src=twsrc%5Etfw”>September 24, 2018</a></blockquote>
<script async src=”https://platform.twitter.com/widgets.js” charset=”utf-8″></script>

This Google Sheets exercise is a simple intro to databases and visualization. Learn spreadsheets to do more.

Data to graphics 101 with Google Sheets. Excel will do the same.Tableau Public is an online tool.

Assignment: Complete the pie chart and embed it in a WordPress post.


This is an update of a Knight Tutorial.

Go to Google Sheets

ss open ss

Click Blank  to create a new Spreadsheet. Note the following features:

  • The menu bar lets you select different commands to change your spreadsheet.
  • A cell is an individual square where you can double-click and type in information.
  • The cells are organized into rows (assigned numbers) and columns (assigned letters).
  • (This screenshot is from is older Google.)

3

Here's what the 2017 edition looks like.

Capture


Make a pie chart

The pie chart is the most ubiquitous of charts. Here's what it is and when to use it.

  • It is a circle divided into segments.
  •  It should illustrate the relationship of the parts of a total.
  • The data may be numeric but it is usually displayed in percentages.
  •  Never more than 5 parts. If you have more than five subsets, consider a TreeMap.

Save your spreadsheet and call it "Pie Chart." You only have to do this once. The document will autosave as you make changes.

Fill in the data as shown below. Select cell A1 by clicking it once. Hold down the Shift key and click in Cell B4 to select the range of data

Screen Shot 2017-09-30 at 4.38.07 PM

Click on "Insert" in the Google Menu Bar and select "Charts." A new window will appear

The "Chart editor" will recommend charts for your data. Under "chart type" choose pie chart. You can customize typeface, color, etc.  Hit insert and the chart will show up on your spread sheet.

Click the menu -- three little dots --on the upper right corner of the chart and choose “Publish chart.”  (You also have the option to copy or save chart as an image here. )

Get link or embed code.

Screen Shot 2017-09-30 at 4.55.54 PM

Capture

Here's what the pie chart looks like embedded.

Why use a BU blog?

  • One reason to use the BU blogs in this class -- versus free wordpress.com --is that they are hosted on the BU server. So you will be able to posts interactive graphics, like the one below.

You can also uses a free wordpress.com site, but know that you won't be able to post much multimedia on it. It will take videos, but not much else. There are workarounds; they are less than idea.

  • Your other option is to pay for a host for your blog. I'm trying out BlueHost for my Boston Boomer news site. This costs $6 a month.

Loading...

Loading...

@niemanfdn @nytmike and @emilysteel from @nytimes about how they’ve covered #SexualHarassment

From a talk Wednesday at Harvard.

Check out their 2017 investigation "Bill O’Reilly Thrives at Fox News, Even as Harassment Settlements Add Up" https://t.co/13NcT5L9zj

Steele said she borrowed from lines in the movie to talk to her sources. Not sure these are the exact lines, but FYI.  sasha 1


More from Spotlight: This follows a delay in the story after 9/11. sasha 2

How newsrooms are adapting to the rising influence of technology companies.

Almost 2 years old. What has happened since then?

From the Tow Center for Digital Journalism at Columbia Journalism School

We found that:

  • Publishers are posting an ever-increasing volume of stories directly to many different platforms, but with little insight as yet into what the long term effects might be.
  • Some platforms and publishers have a very close relationship, with some platforms providing equipment or financial incentives to publishers that use their tools. At least one platform even requires publishers to pay it a percentage of ad revenue in exchange for using the platform.
  • Scale matters. Some smaller and local newsrooms feel left out, whilst the larger or “more digital” publishers that have the closest relationships with platforms dominate attention.
  • Publishers’ anxieties include a lack of data, loss of control, the uncertainty of financial return, and the potential obscurity of their brand in a distributed environment.
  • The question of who owns the user highlights the biggest tension at the heart of the relationship between publishers and platforms. Is a reader of The New York Times on Facebook a New York Times reader, or a Facebook user reading the New York Times?
  • Civic and democratic issues not prioritised by either publishers or platforms include archiving distributed journalism, transparency in algorithmic distribution, concentration of power, and availability of data.