ASHEcon 2012 Ellis Presidential Address

I have just posted the paper version of my June 11, 2012 Presidential Address to the American Society of Health Economists.

The title of the talk and paper is

Five Questions for Health Economists

Here are the five questions in case you want to ponder them before reading the paper.

Q1: If the ceiling in this room fell down and permanently paralyzed both of your legs, what type of health insurance coverage would you want?

Q2. What approach do you prefer to ensure that the individual premiums of older workers (age 65 and over) are not ten times the premium of young workers?

Q3a: If you were to choose one class of providers to give incentives to reduce total health spending, which one would it be?

Q3b. What would be your preferred alternative to fee-for-service payment for primary care practitioners (PCPs)?

Q4 How well is competition working at keeping down the costs of health care in the market where you live?

Q5 Why do economists spend so much time looking under lamp posts?

The written version of the address is now forthcoming (Expected:September, 2012) as Ellis, Randall P., 2012, Five Questions for Health Economists. International Journal of Health Care Finance and Economics, and will be available at www.Springerlink.com.


Average rebate was $151 per family, received by 19-31% of people

Why is this important ACA achievement getting so little attention in the US media?

From the British Medical Journal.

August 7, 2012

US health insurance firms issue $1.1bn in rebates to policy holders

BMJ 2012; 345 doi: 10.1136/bmj.e5329 (Published 7 August 2012)  

Cite this as: BMJ 2012;345:e5329


  1. Janice Hopkins Tanne


Nearly 13 million US citizens are receiving rebates totalling $1.1bn (£0.7bn; €0.9bn) from their health insurance companies this month.

President Barack Obama has pointed to the rebates as a benefit of the Affordable Care Act, the health reform law he passed in March 2010.1

The rebates were due because some health insurance companies failed to spend 80% to 85% of the insurance premiums they received on providing medical care, as required by the law.

The medical loss ratio, as it’s called, was 80:20 for insurance companies providing health insurance to smaller companies and 85:15 for those insuring larger firms. The health insurance companies can spend the remaining 20% or 15% on overheads, administration, bonuses, marketing, advertising, and so on.

Health insurers are now required to report their spending each year to the Department of Health and Human Services. Those that didn’t spend enough on medical care in 2011 have had to issue rebates for the difference. Some large insurers such as Aetna, Cigna, Humana, and United Healthcare were among them.

Consumers in each state received a notice from their insurance company telling them about the 80/20 or 85/15 rule, whether their company met it, and whether they would receive a rebate, said the Department of Health and Human Services. The information will also be posted on the department’s website.

The average rebate was about $151 per family, with rebates varying by insurance company and state.

Most people get their health insurance through their jobs, so their rebate was sent to their employer, which can share the rebate with the employee or use it to reduce future insurance premiums or to improve health benefits.

About 28% of smaller employers and 19% of larger employers providing group health insurance to their employees are getting rebates, said the Kaiser Family Foundation, an independent health policy and communications foundation.

Nearly a third (31%) of people who buy insurance directly from a health insurance company are receiving a rebate cheque in the mail.

The effect of the law is to encourage insurance companies to reduce their expenses, stop raising premiums to increase profits, and spend the premiums they receive on providing medical care.

The Kaiser Family Foundation estimated that the cost of employer provided health insurance plans for a family rose to $15 000 last year.2 Health insurance is paid partly by the employer and partly by the employee.

The law does not apply to people who receive healthcare through the Medicare (government insurance for elderly people and some disabled people) or Medicaid (insurance for poor people) programmes.

Notes

Cite this as: BMJ 2012;345:e5329

References

1.  Tanne JH. US House of Representatives approves historic healthcare reform bill. BMJ2010;340:c1635.
FREE Full Text
2.   Roehr B. Cost of employer provided health insurance double in US in a decade. BMJ2011;343:d6256.
FREE Full Text
Behavioral Economics: Toward a New Paradigm by Amitai Etzioni

I happened upon an interesting article in the American Behavioral Scientist which gave me new insights. I recommend it highly to you.

Behavioral Economics: Toward a New Paradigm

by Amitai Etzioni (George Washington University)

http://icps.gwu.edu/files/2011/09/Beh-Ec-New-Paradigm.pdf

American Behavioral Scientist 55(8) 1099–1119

Abstract
This article discusses the challenges behavioral economics poses for neoclassical economics
and the ways in which the young field may move forward. After reviewing some of
behavioral economics’ accomplishments and the responses to these accomplishments,
the article asks whether its findings can be incorporated into the neoclassical paradigm
and suggests additional steps behavioral economics may consider undertaking in order
to expand its reach.

Risk-adjusted Payment and Performance Assessment for Primary Care

Arlene and I have been working on calibrating risk adjustment models for primary care for four years, and are happy that this work is finally being reflected in a major article in Medical Care in August 2012. The articles are already available online, and should be officially in print soon. The four editorials signal how controversial our approach has proven.


Ash, Arlene S., Ellis, Randall P.  Risk-adjusted Payment and Performance Assessment for Primary Care.
Medical Care 50(8) August 2012.  643-653. DOI: 10.1097/MLR.0b013e3182549c74
Article

Horner, Ronnie D., Risk-adjusted Capitation in an Era of Personalized Medicine: A Dangerous Opportunity to Bend the Health Care Cost Curve.
Medical Care 50(8) August 2012. 633-634. DOI: 10.1097/MLR.0b013e31825c3e14
Editorial

Stukenborg, George J. , Commentary on Ash AS, Ellis RP Risk-adjusted Payment and Performance Assessment for Primary Care.
Medical Care 50(8) August 2012. 635-636. DOI: 10.1097/MLR.0b013e31825ca047
Editorial

Goroll, Allan H. , Risk Adjustment for Primary Care: An Essential Tool for Health System Reform.
Medical Care 50(8) August 2012. 637-639 DOI: 10.1097/MLR.0b013e31825cb499
Editorial

Grazier, Kyle L.,  Risk-adjusted Payment for and Performance Assessment of Primary Care.
Medical Care 50(8) August 2012. 640-642
DOI: 10.1097/MLR.0b013e31825cb487
Editorial


NEJM article on the Supreme Court Decision

I was leaving for vacation the day of the supreme court decision on the ACA, and did not make a posting. The following 2.5 page article from NEJM provides a nice summary of the decisions, which are slightly more complex than has been presented in the media.  The author is a law professor at Suffolk University here in Boston.

R.M. Landers | July 2, 2012 | DOI: 10.1056/NEJMp1206847

http://www.nejm.org/doi/full/10.1056/NEJMp1206847?query=TOC


17-Month Extension of OPT for Econometrics etc.

UPDATE: On May 11, 2012, the U.S. Department of Homeland Security added several fields of study to the list of CIP codes that now qualify for the 17-month extension of initial 12 months of Optional Practical Training (OPT). The new list of  majors - and their corresponding CIP codes - that qualify for the extension (updated in May 2012) include:

45.0603 Econometrics and Quantitative Economics
51.2007 Pharmacoeconomics/Pharmaceutical Economics

For more info visit:
http://www.bu.edu/isso/students/current/f1/employment/off-campus/17MonthExt.html

The list of fields included is shown here.
http://www.ice.gov/doclib/sevis/pdf/stem-list.pdf

Unfortunately the BU Economics program majors do not fit exactly into these areas, so this extension does NOT immediately apply to BU graduates. BU ISSO is working on it though. I apologize that my earlier post was more encouraging.

Ash and Ellis “Risk-adjusted Payment and Performance Assessment for Primary Care” is out

After working in the area for the past three years, I am happy to report that the paper below is finally out in  Medical Care.

Risk-adjusted Payment and Performance Assessment for Primary Care

Ash, Arlene S. PhD; Ellis, Randall P. PhD

The full version is currently posted as printed ahead of print, although the actual date of the publication is not yet known. You will need a OVID or a Lippincott Williams & Wilkins subscription to have access to the full paper. you can see if your university has access by visiting the site above. There is also a rich appendix with further results and tables.

Abstract
Background: Many wish to change incentives for primary care practices through bundled population-based payments and substantial performance feedback and bonus payments. Recognizing patient differences in costs and outcomes is crucial, but customized risk adjustment for such purposes is underdeveloped.

Research Design: Using MarketScan's claims-based data on 17.4 million commercially insured lives, we modeled bundled payment to support expected primary care activity levels (PCAL) and 9 patient outcomes for performance assessment. We evaluated models using 457,000 people assigned to 436 primary care physician panels, and among 13,000 people in a distinct multipayer medical home implementation with commercially insured, Medicare, and Medicaid patients.

Methods: Each outcome is separately predicted from age, sex, and diagnoses. We define the PCAL outcome as a subset of all costs that proxies the bundled payment needed for comprehensive primary care. Other expected outcomes are used to establish targets against which actual performance can be fairly judged. We evaluate model performance using R2's at patient and practice levels, and within policy-relevant subgroups.

Results: The PCAL model explains 67% of variation in its outcome, performing well across diverse patient ages, payers, plan types, and provider specialties; it explains 72% of practice-level variation. In 9 performance measures, the outcome-specific models explain 17%-86% of variation at the practice level, often substantially outperforming a generic score like the one used for full capitation payments in Medicare: for example, with grouped R2's of 47% versus 5% for predicting "prescriptions for antibiotics of concern."

Conclusions: Existing data can support the risk-adjusted bundled payment calculations and performance assessments needed to encourage desired transformations in primary care.

(C) 2012 Lippincott Williams & Wilkins, Inc.

It is currently only available as a publication ahead of print, 2012 Apr 19. [Epub ahead of print]

http://journals.lww.com/lww-medicalcare/Abstract/publishahead/Risk_adjusted_Payment_and_Performance_Assessment.99429.aspx

Risk-adjusted Payment and Performance Assessment for Primary Care.
Ash AS, Ellis RP.

Americans Elect is on Ballot in 25 states

Looking ahead 20 years, it is inconceivable to me that the US will sustain its current archaic primary system for selecting presidents. The new party Americans Elect is one possible new approach. It is getting little publicity relative to the Republican Primary, even though AE is now on the ballot in 25 states. Along with many others, I prefer Obama to the current roster of candidates at Americans Elect, (which includes BU's own Larry Kotlikoff) but I look to AE to play an important role at debates and in our national discourse, even for the coming election. Here is a recent press release from their web site, at http://www.americanselect.org. Worth a visit.

Press Release: AE Hits Halfway Mark for Ballot Access!

WASHINGTON, D.C., APRIL 19, 2012 - Americans Elect has secured ballot access in 25 states. Over 2.5 million people have signed petitions across the country. Demand for a third choice in November is real and Americans Elect is offering that choice. Citizens from across the political spectrum are signing up to change this election and let the people, not the parties, nominate and elect the leadership in the country.

<more>

http://www.americanselect.org/news/4-2012/press-release-ae-hits-halfway-mark-ballot-access

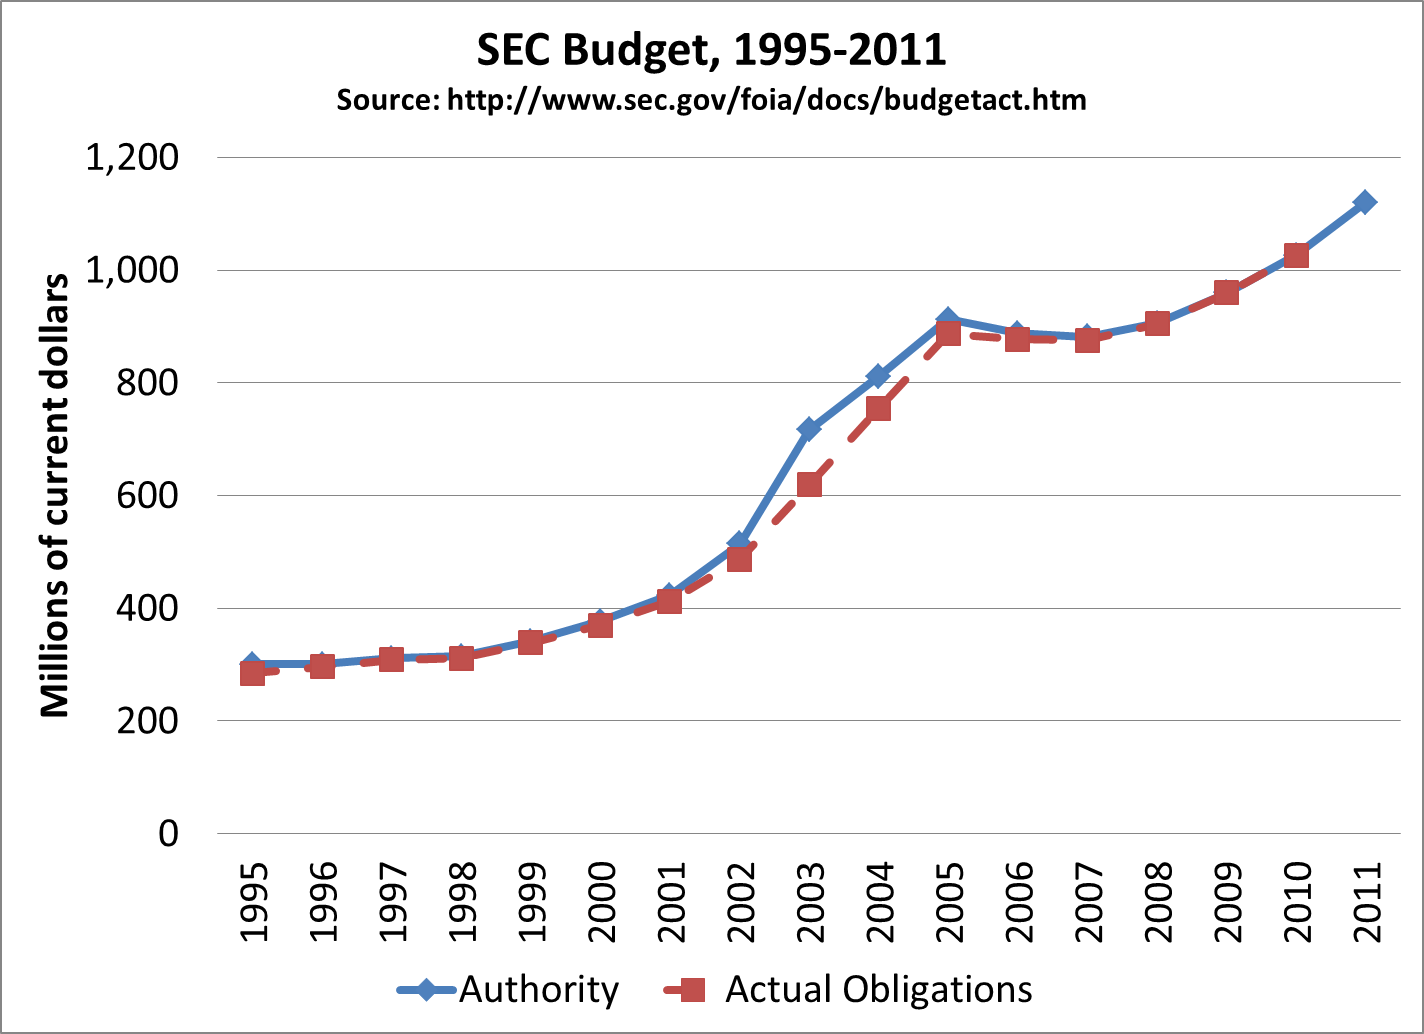
Major cuts to SEC budget preceded the 2008 recession.

I emailed a chart similar to the one below (through 2009) to the BUHealth email list in July 2009.
Note how the SEC budget was cut from 2005-2008.
It was not a surprise that terrible things (Madoff, AIG, Lehman, etc.) became much more of a problem.

My view is that George W. Bush and the Republican congress caused a lack of oversight by the SEC, which caused the 2008-10 financial crisis.

2012 Handbook of Health Economics, on ScienceDirect

2012 Handbook of Health Economics (Pauly, McGuire and Barros) is free on-line. Here is the link to the pdf files.

Excellent literature reviews and new insights. I purchased the hard cover version, but this is wonderfully accessible.

http://www.sciencedirect.com/science/handbooks/15740064

Many research universities, including BU have access to ScienceDirect.

It is unusual for Elsevier to post its new material for free access in this way.

Enjoy.

US Physician office visits declined 17% from 2009-2011

Being insured is no guarantee unemployed will seek care

Research suggests they may be unable to cover co-pays and deductibles, or fear they cannot afford the expenses that result.

By Victoria Stagg Elliott, amednews staff. Posted Feb. 7, 2012.

Unemployed people who have private health insurance are less likely to put off care because of cost than those without insurance or on public plans. But they are much more likely than the employed to stay away from the doctor's office.

"Even if you have insurance, you typically have to pay 20% or more of the price, and when you become unemployed, you become more cautious about spending money," said Randall Ellis, PhD, professor of economics at Boston University and president of the American Society of Health Economists. "You put off preventive visits, and if you have the flu, you choose not to go in for treatment."

About 29.3% of the unemployed had private insurance, according to a data brief issued Jan. 24 by the Centers for Disease Control and Prevention's National Center for Health Statistics analyzing adults 18-64 who participated in the National Health Interview Survey for 2009-2010 (www.cdc.gov/nchs/data/databriefs/db83.htm).

Full article is here.

http://www.ama-assn.org/amednews/2012/02/06/bisd0207.htm

Puzzling fact is that outpatient office visits declined by 17%:

"Outpatient office visits declined 17% among patients with private insurance -- from 156 million in the second quarter of 2009 to 129 million in the second quarter of 2011."

(Ibid)

Yet  total private insurance spending on physicians remained almost unchanged.

2009 2010 Change
Total $408.3 billion $415.8 billion 1.8%
Private insurance $209.0 billion $209.4 billion 0.2%

Source: National Health Expenditure Data, Centers for Medicare & Medicaid Services Office of the Actuary, January (www.cms.gov/nationalhealthexpenddata/01_overview.asp)

Also see: http://www.ama-assn.org/amednews/2012/01/23/gvl10123.htm

Could be worth exploring...

ARF 2009-10 is available free

ARF=Area Resource File

2009-2010 ARF Can Now Be Downloaded at No Cost.

The 2009-2010 ARF data files and documentation can now be downloaded. Click the link below to learn how to download ARF documentation and data.

http://arf.hrsa.gov/purchase.htm

"The basic county-specific Area Resource File (ARF) is the nucleus of the overall ARF System. It is a database containing more than 6,000 variables for each of the nation's counties. ARF contains information on health facilities, health professions, measures of resource scarcity, health status, economic activity, health training programs, and socioeconomic and environmental characteristics. In addition, the basic file contains geographic codes and descriptors which enable it to be linked to many other files and to aggregate counties into various geographic groupings."

"You may also choose to search the ARF to see what data variables are available in the current file."

The table of contents below gives a sense of the county level information included.


I.       DATA ELEMENT DESCRIPTIONS AND REFERENCES. 1
A.  CODES AND CLASSIFICATIONS. 1
A-1)        Header for ARF. 1
A-2)        State and County Codes. 1
A-3)        Census County Group Codes. 7
A-4)        County Typology Codes. 7
A-5)        Metropolitan/Micropolitan and Combined Statistical Areas. 10
A-6)        Rural/Urban Continuum Codes. 11
A-7)        Urban Influence Codes. 13
A-8)        BEA Economic Area Codes and Names and Component Economic 14                          Area Codes and Names.
A-9)        Federal Region Code and Census Region and Division Codes and Names. 14
A-10)     Veterans Administration Codes. 16
A-11)     Contiguous Counties. 17
A-12)     Health Service Area Codes. 18
A-13)     Area Health Education Center (AHEC) Codes and Names. 18
A-14)     HPSA Codes. 19
A-15)     SSA Beneficiary State and County Codes. 21
B.   HEALTH PROFESSIONS. 22
B-1)        Physicians. 22
B-2)        Dentists and Dental Hygienists. 31
B-3)        Optometrists. 36
B-4)        Pharmacists. 37
B-5)        Podiatrists. 38
B-6)        Veterinarians. 39
B-7)        Nurses. 40
B-8)        Physician Assistants. 43
B-9)        Chiropractors. 45
B-10)      Occupational Therapists. 46
B-11)      Physical Therapists. 46
B-12)      Psychology and Social Work Teachers. 47
B-13)      Psychologists. 47
B-14)      Sociologists. 48
B-15)      Social Workers. 48
B-16)     Audiologists   49
B-17)     Speech Language Pathologists  49
B-18)      Healthcare Practitioner Professionals. 50
B-19)      Decennial Census Occupation Data. 50
C.  HEALTH FACILITIES. 53
C-1)        Hospital Type. 54
C-2)        Hospital Services (or Facilities) 57
C-3)        Hospital Employment 57
C-4)        Nursing and Other Health Facilities. 58
C-5)        Health Maintenance Organizations. 60
C-6)        Preferred Provider Organizations (PPOs) 61
D.  UTILIZATION.. 61
D-1)        Utilization Rate. 62
D-2)        Inpatient Days. 62
D-3)        Outpatient Visits. 62
D-4)        Surgical Operations and Operating Rooms. 62
E.   EXPENDITURES. 63
E-1) Hospital Expenditures. 63
E-2) Medicare Advantage Adjusted Average Per Capita Cost (AAPCC) 63
F.   POPULATION.. 68
F-1) Population Estimates. 68
F-2) Population Counts and Number of Families and Households. 72
F-3) Population Percents. 82
F-4) Labor Force. 84
F-5) Per Capita Incomes. 86
F-6) Income. 88
F-7) Persons and Families Below Poverty Level 90
F-8) Ratio of Income to Poverty Level 92
F-9) Median Family Income. 93
F-10)      Household Income. 93
F-11)      Medicaid Eligibles. 97
F-12)      Medicare Enrollment Data. 99
F-13)      Medicare Advantage/Managed Care Penetration. 100
F-14)      Medicare Prescription Drug Plan (PDP) Penetration. 103
F-15)      Health Insurance Estimates. 103
F-16)      Food Stamp/SNAP Recipient Estimates. 104
F-17)      Social Security Program.. 104
F-18)      Supplemental Security Income Program Recipients. 105
F-19)      5‑Year Infant Mortality Rates. 107
F-20)      Infant Mortality Data. 108
F-21)      Mortality Data. 108
F-22)      Total Deaths. 111
F-23)      Natality Data. 111
F-24)      Births in Hospitals. 113
F-25)      Total Births. 113
F-26)      Education. 114
F-27)      Census Housing Data. 114
F-28)      Veteran Population. 117
G.  ENVIRONMENT.. 119
G-1)        Land Area and Density. 119
G-2)        Population Per Square Mile. 119
G-3)        Elevation. 119

FAIR Health claims data, N=125 million

Window to the marketplace

FAIR Health now delivers the industry's primary source of out-of-network benchmarks with unprecedented transparency

"What was referred to as a "black box" in February 2008 today has become an open window to the healthcare marketplace. The industry's privately owned database of usual-and-customary (UC) charge information is now a transparent, public information source called FAIR Health."

http://managedhealthcareexecutive.modernmedicine.com/mhe/Executive+Profile/Window-to-the-marketplace/ArticleStandard/Article/detail/747558?contextCategoryId=47227

Data sources

"Currently, FAIR has approximately 80 different data sources nationwide, collectively contributing claims data for 125 million covered lives. Data is deidentified as to the payer source and the individual member's identity. By aggregating claims in this way, FAIR can meet HIPAA requirements and discourage the use of information for competitive advantages among participating payers.

Gelburd says the required fields that FAIR collects from the claims data supplied by contributors include CPT codes, standard charges, date and location of service. Additional fields include ICD-9 and ICD-10 codes, provider identifiers and negotiated, in-network charges. The optional fields are particularly useful from a research perspective."

I would welcome comments from anyone who has used this data.

Randy


MBTA considering halting weekend service

I urge people from MA to sign the following petition. Halting weekend commuter rail service would be a detriment to the city, state and the environment.

Visit the site to see the wording of the petition.

Subject: Save Jobs, Environment & Accessibility

Hi,
In an effort to reduce the deficit of Massachusetts' public transit system (the MBTA), one of the proposals under consideration is cancellation of commuter rail service on Saturdays and Sundays. These environmentally friendly trains connect Boston with cities and towns in a 60-mile radius allowing access to jobs, loved ones, culture, recreation and the list goes on and on.
That's why I signed a petition to Richard A. Davey, MassDOT Secretary and Chief Executive Officer, Jonathan R. Davis, Acting General Manager Massachusetts Bay Transportation Authority, and Governor Deval Patrick.
Will you sign this petition? Click here:
http://signon.org/sign/save-jobs-environment?source=s.em.cp&r_by=1994032
Thanks!

Randy Ellis

Which US Presidents Grew the Public Debt Fastest?

US Public Debt Fiscal Years 1960-2011

This figure, based on US treasury numbers, is in nominal dollars. Each president is credited with the debt created in the year after leaving office since budgets are largely set the year before.

Democratic presidents were in office for $4.6 trillion in debt since 1960, Republican presidents for $9.9 trillion.

The rate of increase in the US public debt grew under Reagan and Bush Jr, and slowed down under Clinton and Obama.

Brocolli and Insurance Mandate

This is an excellent short NEJM article summarizing why the federal government does have the authority to mandate that people buy health insurance.   Written by a Harvard Law School professor.

The Irrelevance of the Broccoli Argument against the Insurance Mandate

Einer Elhauge, J.D.

N Engl J Med 2012; 366:e1January 5, 2012

Favorite passage:

"Others argue that the Constitution's framers could not possibly have envisioned a congressional power to force purchases. However, in 1790, the first Congress, which was packed with framers, required all ship owners to provide medical insurance for seamen; in 1798, Congress also required seamen to buy hospital insurance for themselves. In 1792, Congress enacted a law mandating that all able-bodied citizens obtain a firearm. This history negates any claim that forcing the purchase of insurance or other products is unprecedented or contrary to any possible intention of the framers."