Category Archives: General Economics

A model for US: $1 coins and no pennies

I just returned from a vacation in Ecuador (which is spectacular) but wanted to post about a wonderful feature of their monetary system.

Ecuador does not have its own currency but instead uses the US dollar as their only currency. US dollar bills and coins are used everywhere, which is very convenient for visitors. But they do two intelligent things.

* They do not use paper $1 bills, but instead rely almost solely on the US-minted Sacagawea dollar coins for transactions.

* They generally do not use pennies but instead round transactions to the nearest nickel.

(They do mint their own Ecuadorian US-size dimes, quarters and nickels to make up for their shortage, using the same front side but a different reverse. They must have imported millions of $1 dollar coins.)

Wouldn’t be nice if the US adopted this system!


Read Flash Boys by Michael Lewis

I just finished reading the book Flash Boys by Michael Lewis (author of Moneyball and the Big Short). I highly recommend it to economists as a quick read (270 pages) in accessible prose. Or anyone.

http://www.amazon.com/Flash-Boys-Wall-Street-Revolt/dp/0393244660/

Every economist should be aware of the grossly unfair trading practices that the SEC and NASDAQ have allowed to dominate virtually all stock trades. Lewis documents a large number of explicit rip off techniques from High Frequency Traders (HFT) (which include most of the major money managers) that affect every mutual fund, stock broker and stock trade conducted in the world.   While true that HFT create liquidity in the market so that traders can instantly sell whatever stocks at "the market price"  in whatever quantities, they do this at the cost of a significant tax on all such transactions and result in billions of dollars of revenue for the HFT companies. Basically, the HFT can influence the market price. This is done in plain sight (the title of chapter 1), not hidden in the form of impenetrable documents such as the the unsecured and overrated mortgage securities.

Since many of you won't read the book, here is a flavor in my own words.

Your pension fund ABC, which manages a few billions of dollars of stocks, is constantly buying and selling stocks on your behalf to maintain its portfolio. Say it  wants to buy 10,000 shares of Microsoft "at the current price" which is $41.90 (the most recently traded price right now on 6/30/2014). The official NASDAQ ticker price shows more than 10,000 shares are offered at $41.90. But as soon as ABC's bid to buy "at market" is executed, essentially all of those available shares are purchased by HFT within a few microseconds (i.e., a few millions of a second) BEFORE ABC's purchase, thereby bidding up the price. It could be a penny or it could be much much more, depending on how volatile the stock price is. Today, Microsoft has already varied by .82%, so the variation WITHIN A FEW MICROSECONDS can easily be that amount and you would not even know. Your price at the end of the day would be within the low and high for the day.  ABC pays say $41.95, and the HFTs pocket the extra five cents per share on the trade since they were able to purchase at $41.90 before selling it back to you a few microseconds later at $41.95.

You think that it doesn't matter much because it was only a few pennies on the transaction, and you hold onto your assets for years. But your pension fund is constantly buying and selling as more funds are added, taken out, or market shares of different stocks change. All of these transactions are "taxed" by the HFT firms who buy at below your bid price and then sell the stock to ABC at NO RISK. According to the book, the best HFT firms have traded for years and never had a losing day, since they only bet on sure things.

Here is a second example. You may think there is only one market for each stock, but actually there are more than a dozen different prices since a majority of all trades happen in "dark pools" which are private exchanges organized by the large money managers. The official offer price may appear to be $10.05 but you don't know that some of these dark pools have offer to sell prices of as little as $10.00.  What the market is supposed to do is that if you bid "at market" then you get the lowest value price, which would be $10. What actually happens is that the HFT firms turn this into two transactions, buying at $10.00 and selling  to you at $10.05. Again, it doesn't sound like much until you realize how many millions of transactions there are.

What I found particularly unfair is that the SEC has allowed all kinds of sleazy types of stock sales practices, involving small lot transactions, and bids for shares at prices that need not be honored. This makes it very low cost/low risk for the HFT to figure out who is buying or selling, and take advantage of it.

There is a new exchange called IEX that is trying to become a fair exchange, with some success, but it is getting major push back from the big players. Read more here. http://en.wikipedia.org/wiki/IEX

Congratulations to BU’s Class of 2014 Economics graduates!

Please celebrate the 463 Boston University students who earned degrees in Economics at Commencement over the weekend. This year the program contained:

17 Ph.D. recipients

207 Master's degree recipients (MA, MAPE, MAEP, MAGDE MA/MBA, BA/MA)

256 BA recipients (including BA/MA)

This represents a total of 463 degrees!

These numbers undercount the total for the year since they exclude students who graduated in January 2014 and chose not to appear at Commencement.

The number of graduate degree recipients (234) remains close to the number of  BA students (256) both of which are down from the previous year, which was itself up 10% over 2012.

Last year (2013) there were 21 PhDs, 257 Master's degree recipients, and 292 BA recipients.

Altogether 23 Ph.D. students obtained jobs this year. To see their placements visit the web site linked here.

http://www.bu.edu/econ/gradprgms/phd/placements/

Many MA students did well on the job market and in being accepted to Ph.D. programs. For a partial list see:
http://www.bu.edu/econ/2014/05/16/ma-students-admitted-to-top-phd-programs/

The department's recently redesigned website now lists 38 regular professors, a number which is down two since 2012.
http://www.bu.edu/econ/people/faculty/

Congratulations to all!

Explaining these two graphs should merit a Nobel prize

Reposting from The Incidental Economist Blog

What happened to US life expectancy?

Posted: 07 Jan 2014 03:00 AM PST

Here’s another chart from the JAMA study “The Anatomy of Health Care in the United States”:

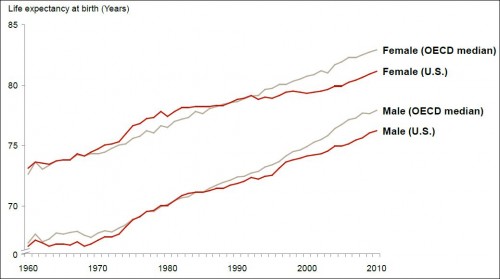
life expectancy at birth

Why did the US fall behind the OECD median in the mid-1980s for men and the early 1990s for women? Note, the answer need not point to the health system. But, if it does, it’s not the first chart to show things going awry with it around that time. Before I quote the authors’ answer, here’s a related chart from the paper:

ypll

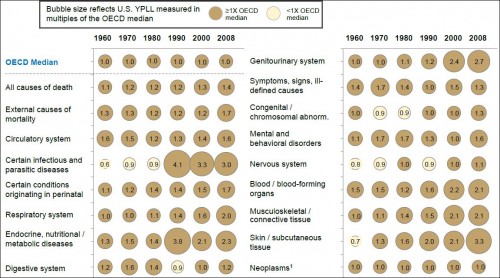
The chart shows years of potential life lost in the US as a multiple of the OECD median and over time. Values greater than 1 are bad (for the US). There are plenty of those. A value of exactly 1 would mean the US is at the OECD median. Below one would indicate we’re doing better. There’s not many of those.

It’d be somewhat comforting if the US at least showed improvement over time. But, by and large, it does not. For many conditions, you can see the US pulling away from the OECD countries beginning in/around 1980 or 1990, as was the case for life expectancy shown above. Why?

The authors’ answer:

Possible causes of this departure from international norms were highlighted in a 2013 Institute of Medicine report and have been ascribed to many factors, only some of which are attributed to medical care financing or delivery. These include differences in cultural norms that affect healthy behaviors (gun ownership, unprotected sex, drug use, seat belts), obesity, and risk of trauma. Others are directly or indirectly attributable to differences in care, such as delays in treatment due to lack of insurance and fragmentation of care between different physicians and hospitals. Some have also suggested that unfavorable US performance is explained by higher risk of iatrogenic disease, drug toxicity, hospital-acquired infection, and a cultural preference to “do more,” with a bias toward new technology, for which risks are understated and benefits are unknown. However, the breadth and consistency of the US underperformance across disease categories suggests that the United States pays a penalty for its extreme fragmentation, financial incentives that favor procedures over comprehensive longitudinal care, and absence of organizational strategy at the individual system level. [Link added.]

This is deeply unsatisfying, though it may be the best explanation available. Nevertheless, the sentence in bold is purely speculative. One must admit that it is plausible that fragmentation, incentives for procedures, and lack of organizational strategy could play a role in poor health outcomes in the US — they certainly don’t help — but the authors have also ticked off other factors. Which, if any, dominate? It’s completely unclear.

Apart from the explanation or lack thereof, I also wonder how much welfare has been lost relative to the counterfactual that the US kept pace with the OECD in life expectancy and health spending. It’s got to be enormous unless there are offsetting gains in areas of life other than longevity and physical well-being. For example, if lifestyle is a major contributing factor, perhaps doing and eating what we want (to the extent we’re making choices) is more valuable than lower mortality and morbidity. (I doubt it, but that’s my speculation/opinion.)

(I’ve raised some questions in this post. Feel free to email me with answers, if you have any.)

@afrakt

Latest REPEC rating has BU economics at #10!

I know rankings of departments are always imprecise, but I think  BU Economics should be proud that REPEC, (REsearch Papers in EConomics), which measures research output on 31 dimensions and takes an average, currently puts us at #10 in the US, just behind Yale, and ahead of Penn, Brown, Michigan and Northwestern. Keep up the great productivity!


Here is the link.
http://ideas.repec.org/top/top.usecondept.html

In case it changes before you look, or your don't have time, here are the top 30 places.

Top 25% US Economics Departments
Please note that rankings can depend on the number of registered authors in the respective institutions. Register at the RePEc Author Service.
Rank	Institution	Score	Authors	Author shares
1	Department of Economics, Harvard University Cambridge, Massachusetts (USA)
	1.02	64	50.86
2	Economics Department, Massachusetts Institute of Technology (MIT)Cambridge, Massachusetts (USA)
	2.3	41	32.55
3	Department of Economics, University of Chicago Chicago, Illinois (USA)
	3.41	41	34.28
4	Department of Economics, Princeton University Princeton, New Jersey (USA)
	3.87	47	33.41
5	Department of Economics, University of California-Berkeley Berkeley, California (USA)
	4.16	45	34.66
6	Department of Economics, New York University (NYU) New York City, New York (USA)
	6.39	54	40.17
7	Department of Economics, School of Arts and Sciences, Columbia University New York City, New York (USA)
	7.58	52	40.63
8	Department of Economics, Stanford University Stanford, California (USA)
	8.18	55	44.19
9	Economics Department, Yale University 
New Haven, Connecticut (USA)
	9.62	52	30.74
10	Department of Economics, Boston University Boston, Massachusetts (USA)
	11.89	52	42.41
11	Department of Economics, University of Pennsylvania Philadelphia, Pennsylvania (USA)
	12.33	38	33.32
12	Economics Department, Brown University 
Providence, Rhode Island (USA)
	12.76	41	37.31
13	Economics Department, University of Michigan 
Ann Arbor, Michigan (USA)
	12.86	68	53.1
14	Department of Economics, Northwestern University 
Evanston, Illinois (USA)
	12.93	35	30.54
15	Finance & Economics Department, Graduate School of Business, Columbia University New York City, New York (USA)
	14.36	25	20.52
16	Department of Economics, University of California-San Diego (UCSD) La Jolla, California (USA)
	16.29	42	34.57
17	Department of Economics, University of California-Los Angeles (UCLA) Los Angeles, California (USA)
	16.9	42	32.8
18	Economics Department, University of Wisconsin-Madison Madison, Wisconsin (USA)
	20.34	36	24.97
19	Department of Economics, Cornell University Ithaca, New York (USA)
	20.53	45	28.04
20	Economics Department, Dartmouth College Hanover, New Hampshire (USA)
	21.04	30	27.25
21	Department of Economics, Boston College Chestnut Hill, Massachusetts (USA)
	21.32	46	40.43
22	Economics Department, University of California-Davis Davis, California (USA)
	22.1	38	34.98
23	Department of Economics, University of Maryland College Park, Maryland (USA)
	22.76	43	35.97
24	Economics Department, Georgetown University Washington, District of Columbia (USA)
	23.21	43	34.12
25	Department of Economics, Duke University Durham, North Carolina (USA)
	23.95	43	34.71
26	Department of Economics, Vanderbilt University Nashville, Tennessee (USA)
	25.5	33	31.14
27	Department of Economics, University of Minnesota Minneapolis, Minnesota (USA)
	26.67	27	20.99
28	Economics Department, Michigan State University East Lansing, Michigan (USA)
	27.5	38	32.35
29	Economics Department, Stern School of Business, New York University (NYU) New York City, New York (USA)
	27.98	23	20.61
30	Department of Economics, University of California-Santa Barbara (UCSB) Santa Barbara, California (USA)
	29.55	31	26.08

This page shows one of the many rankings computed with RePEc data. They 
are based on data about authors who have registered with the RePEc Author Service, institutions listed on EDIRC, bibliographic data collected by RePEc, citation analysis performed by CitEc and popularity data compiled by LogEc. To find more rankings, historical data and detailed methodology, click here. Or see the ranking FAQ.
These rankings take only into account institutions registered in EDIRC and authors registered with the RePEc Author Service
 and the institutions they claimed to be affiliated with. For US 
Economics Departments, these are 478 institutions. Institutions need 
satisfy the following criteria to be included: Institutions having the 
following words in its name or its name translation on EDIRC: Economics and one of School, Department, Division or Faculty; be located in the United States.


AHRF/ARF 2012-13 data is available free

AHRF=Area Health Resource File (Formerly ARF)

2012-2013 ARHF can now be downloaded at no cost.

The 2012-2013 ARF data files and documentation can now be downloaded. Click the link below to learn how to download ARF documentation and data.

http://arf.hrsa.gov/

“The Area Health Resources Files (AHRF)—a family of health data resource
products—draw from an extensive county-level database assembled annually from
over 50 sources. The AHRF products include county and state ASCII files, an MS Access
database, an AHRF Mapping Tool and Health Resources Comparison Tools (HRCT). These
products are made available at no cost by HRSA/BHPR/NCHWA to inform health resources
planning, analysis and decision making..”

"The new AHRF Mapping Tool enables users to compare the availability of healthcare providers as well as environmental factors impacting health at the county and state levels."

Joe Stiglitz Essay on Martin Luther King and inequality

My colleague Michael Manove forwarded this article which is worth reading and pondering.

It is available directly at the New York Times at the link below. Two pages.

http://opinionator.blogs.nytimes.com/2013/08/27/how-dr-king-shaped-my-work-in-economics/?_r=0

The Great Divide August 27, 2013, 8:58 pm 167 Comments
How Dr. King Shaped My Work in Economics
By JOSEPH E. STIGLITZ

"I had the good fortune to be in the crowd in Washington when the Rev. Dr. Martin Luther King Jr.
gave his thrilling “I Have a Dream” speech on Aug. 28, 1963. I was 20 years old, and had just finished
college. It was just a couple of weeks before I began my graduate studies in economics at the
Massachusetts Institute of Technology..."

Our Daily US Gun Killings

This repost is from the Daily Kos.

http://www.dailykos.com/story/2013/04/01/1198534/-Another-day-in-the-Gun-Crazy-U-S-A

While Sandy Hook murders and the Marathon Bombing get a lot national attention, it is the daily tragedy of gun shootings and killings that should be of greatest concern. The Daily Kos simply compiled lists of all of the daily reports of murders for a week ending April 1 on the above web site.  Here is the April 1 media summary, the Monday after Easter.

April 1, 2013 edition (Monday)


Northwest Miami-Dade, Fla. -- A 4-year-old girl died after being struck by a bullet while sitting in a parked car at a residence along with several other children about 6:10 p.m. Saturday. Police believe one of the children might have accidentally fired the gun.

Kansas City, Mo. -- A 14-year-old boy, a middle school student, was shot and killed on a street when someone fired at him from a passing car about 3 p.m. Saturday. A 15-year-old boy who was with the victim was not injured.

Indianapolis, Ind. -- A man cleaning his gun was killed about 3:30 p.m. Saturday when the weapon accidentally discharged.

Philadelphia, Penn. -- A 27-year-old woman was accidentally shot and killed by her 28-year-old boyfriend about 7:45 p.m. Saturday. The boyfriend says he was arguing with a neighbor, possibly an uncle, when the neighbor threatened him with a hammer. Fearing for his safety, the boyfriend took out a gun, but then tripped and accidentally pulled the trigger, shooting the woman in the neck.

Cleveland Heights, Calif. -- A 25-year-old woman was apparently accidentally shot and killed outside a restaurant by a security guard about 3 a.m. Saturday. Police say the victim and three other women were involved in an altercation with the guard inside the restaurant. As he was escorting them off the property, he was knocked to the ground and his weapon discharged, hitting the victim.

Harrisburg, N.C. -- A 50-year-old man shot and killed two of his neighbors -- a 64-year-old man and a 42-year-old man -- in the backyard of one of their homes on a cul-de-sac. He then used the gun to kill himself after a several-hours-long standoff with police. The shooting was related to a dispute of some sort.

Ashtabula, Ohio -- A 52-year-old man was shot and killed outside a church by his 25-year-old son shortly after Easter services ended about 1:15 p.m. Sunday.

Hartford, Conn. -- A 22-year-old man was shot to death behind a building about 9:20 p.m. Sunday. He was hit once in the head.

Forney, Tex. -- A 63-year-old man and his 65-year-old wife were found shot to death at their home Saturday night. The man was the district attorney for the county and police believe the victims were targeted.

North Harris County, Tex. -- A 25-year-old man was fatally shot outside a house about 11:30 p.m. Saturday night.

Los Angeles, Calif. -- About 11:10 p.m. yesterday, a man and woman encountered two gunmen after they went outside their home to investigate a car-alarm that was going off. A confrontation resulted and it ended up in the house where the man, 50 years old, was shot twice in the chest. He died a short time later. Police report that the gunmen and the victim might have known each other.

Washington, D.C. -- A 33-year-old man was shot and killed about 2:10 a.m. Saturday outside an apartment complex. He had been shot in the chest.

Melbourne, Fla. -- A sales manager at an auto dealership was shot and killed during an apparent road-rage incident while test-driving a vehicle for a trade-in. During the test drive, the manager stopped to make a right-hand turn and was rear-ended by another car. The driver of that car, a 64-year-old man, then shot the victim, killing him.

Oakland, Calif. -- A 31-year-old man was fatally shot while sitting inside a car around 10 a.m. yesterday. The gunman fled in a vehicle.

Oakland, Calif. -- A man was fatally shot while on a street about 4:10 p.m. yesterday.

Oakland, Calif. -- A man was fatally shot while on a street about 8:10 p.m. yesterday.

Jacksonville, Fla. -- A 32-year-old man was fatally shot Sunday morning after getting into a disagreement with a 20-year-old man. Police are looking for the suspect.

Brooklyn, N.Y. -- A 37-year-old livery-cab driver on his way to pick up a fare was killed about 12:45 a.m. today after being shot in the face and crashing his minivan.

Bronx, N.Y. -- A 28-year-old man was shot in the throat and killed about 12:15 a.m. yesterday inside an apartment building.

Las Vegas, Nev. -- A 43-year-old man is a suspect in the shooting deaths of his mother and father. The son claimed he found the couple fatally shot inside their home about 9 p.m. Friday. Police initially thought it was a case of murder-suicide, but now believe the son killed them.

St. Louis, Mo. -- When someone in a passing car shot at a group of people, one of the bullets struck a 4-year-old girl in the shoulder as she walked with her mother up the steps of a home. Police arrested a 23-year-old man in connection with the incident.

South Pittsburgh, Tenn. -- About 6:30 p.m. Thursday, a 13-year-old was struck in the shoulder by a bullet when his father tested his gun by firing it from his back porch into thick woods. The father didn’t know his son was in the woods; he thought the boy was inside the house. The victim was listed in good condition.

Madison County, Ga. -- A 17-year old boy watching TV in a living room accidentally shot himself in the hand while trying to unload a pistol on Saturday.

Port Deposit, Md. -- A 20-year-old man accidentally shot himself in the torso when he tripped and fell while walking back to his house after target shooting Saturday about 2:30 p.m. No word on his condition.

Chicago, Ill. -- Someone in a moving car opened fire on a 21-year-old man sitting on a porch about 7:30 p.m. yesterday. The victim was struck in the abdomen and was listed in serious condition.

Chicago, Ill. -- A 26-year-old man was shot in the hip and knee while leaving a store about 9:15 p.m. yesterday. He was listed in critical condition.

Chicago, Ill. -- A 29-year-old man walking down a street was shot in the leg about 9:50 p.m. when someone fired shots at him from a passing car. He was listed in stable condition.

Stamford, Conn. --About 7 p.m. Thursday, a 26-year-old man accidentally shot himself in the leg at his residence while cleaning his semi-automatic gun after returning from a firing range. No word on his condition.

Milwaukee, Wis. -- About 9:15 p.m. Saturday, a 17-year-old male was shot by someone during an altercation over a female acquaintance. No word on his condition.

New Orleans, La. -- A man was shot in the foot about 7 p.m. yesterday. No word on his condition.

Oakland, Calif. -- Someone was shot about 7 p.m. yesterday. No word on the victim’s condition.

Jacksonville, Fla. -- A man was shot in the upper torso about 9 p.m. yesterday. He was expected to survive.

Washington, D.C. -- A 16-year-old boy was shot and wounded while on a street about 12:40 a.m. today when someone in a car fired at him. His injuries were reported as non life-threatening.

Jacksonville, Fla. -- A man sitting in front of a house with two or three friends was shot twice in the leg about 5 p.m. Saturday when a car pulled up and someone in the car opened fire. The victim was reported to have non life-threatening injuries.

Oregon City, Ore. -- After a 22-year-old woman parked her car about 10:20 p.m. Sunday, a male stranger approached from behind and grabbed her hair and then began dragging her backward. The assailant fled when she pulled out a handgun and pointed it at him.

Today’s sources: Akron Beacon Journal, cecildaily.com, Chicago Tribune, Denver Post, Hartford Courant, Houston Chronicle, KABC-TV Los Angeles, KCTV-TV Kansas City, madisonjournaltoday.com, Milwaukee Journal-Sentinel, Oakland Tribune, The Oregonian, Orlando Sentinel, stamfordpatch.com, Times-Picayune, Washington Post, WCAU-TV Philadelphia, WISH-TV Indianapolis, WRCB-TV Chattanooga, WSOC-TV Charlotte, WTLV-TV Jacksonville

http://www.dailykos.com/story/2013/04/01/1198534/-Another-day-in-the-Gun-Crazy-U-S-A
Useful reference for serious SAS programmers

I often do bootstrap and simulations in my research, and for some background research, I found the following excellent short article on how to use SAS to do efficient replications/bootstrapping/jackknifing.

Paper 183-2007
Don't Be Loopy: Re-Sampling and Simulation the SAS® Way
David L. Cassell, Design Pathways, Corvallis, OR

http://www2.sas.com/proceedings/forum2007/183-2007.pdf

Here is an elegant example that shows how to do 1000 replications of the Kurtosis of X. Note that proc univariate could be replaced with anything. Discussion of proc append and critique of alternative programs is also useful.

(I will note that it starts by creating a sample that is 1000 times as large as the original, but still, it is very fast given what is being done.)

proc surveyselect data=YourData out=outboot /* 1 */
seed=30459584 /* 2 */
method=urs /* 3 */
samprate=1 /* 4 */
outhits /* 5 */
rep=1000; /* 6 */
run;
proc univariate data=outboot /* consider noprint option here to reduce output */;
var x;
by Replicate; /* 7 */
output out=outall kurtosis=curt;
run;
proc univariate data=outall;
var curt;
output out=final pctlpts=2.5, 97.5 pctlpre=ci;
run;

31 charts to destroy your faith in humanity

This humorous web site from the Washington Post's WonkBlog is worth a look. It will only take a couple of minutes.

31 charts that are informative but illustrates how one can put a negative spin on anything.

http://www.washingtonpost.com/blogs/wonkblog/wp/2013/05/24/these-31-charts-will-destroy-your-faith-in-humanity/

Here is the original post that it is spoofing.

http://www.businessinsider.com/charts-that-will-restore-your-faith-in-humanity-2013-5

#5 “Let the Children and Grandchildren Pay?”

Time to Change the Tax Discussion #5

This is the  fifth and final posting in a five part series about taxes.

Every time congress passes legislation to increase public spending, they should have to specify which taxes they favor increasing to balance the budget. If not, then congress should have to openly discuss why they believe it is appropriate to LET THE CHILDREN AND GRANDCHILDREN PAY. If every unfunded benefit increase included this selfish labeling of the congressmen who voted for it, perhaps it would make it more stigmatizing to fight unfunded wars, increase discretionary spending (e.g., disaster relief) or resist Medicare payment increases without other spending cuts or tax increases.

Case in point: as I write this blog the House is debating how large the Hurricane Sandy relief fund should be, in the neighborhood of $50 billion ($160 per American). While I favor this expenditure, but I also favor committing to how we will pay for it (even if we only start next year...) This is a large enough expense that Congress should also be committing to the tax increase that will pay for it. For example 1% more income tax on the wealthy, or eliminating one subsidy or tax subsidy would do it. Note that ObamaCare legislation was forced to do this. It is possible.

Almost every Republican in Congress has signed Grover Norquist's No Tax Pledge not to increase any taxes, ever. This pledge is highly destructive of rational discussion of taxes and deficit reduction. I would be much happier if fiscally conservatives  instead signed a pledge not to increase our budget deficit ( and hence national debt) unless it is specifically part of an economic stimulus to deal with a potential or actual recession. Too often we have cut taxes even in times of a growing economy, effectively pushing onto our children and grandchildren (who do not even vote yet) the burden of paying for our overspending.

Increasing taxes will never be attractive, but why should we LET THE CHILDREN AND GRANDCHILDREN PAY?

Here are links to my four previous blogs on Taxes

#1 All Taxes and Budgets Should be Expressed as Dollars per Person

#2. Include Social Security and Medicare taxes when discussing tax burdens

#3 Tax Bads (or at least don’t subsidize them!)

#4 State Tax Rates are Not Related to State Income or Growth

#5 "Let the Children and Grandchildren Pay?"

#4 State Tax Rates are Not Related to State Income or Growth

Time to Change the Tax Discussion #4

This is the fourth in a five part series about taxes.

It has  become common in the media to argue that state income or sales taxes cannot be increased or it will dampen incentives and hurt the state or local economy. While this might be true at sufficiently high tax rates, there is no evidence that tax rates currently imposed on income or sales by states has any effect on the level or growth rates of the state economy. The following nine plots will let you decide for yourself whether there is any relation between

{Sales tax revenue, income tax revenue, or total state and local government revenue}

and

{Levels of Gross State Product per Capita, One year changes in Gross State Product (the "recovery") and Ten year changes in Gross State Product per Capita)

If there is, it is a very weak relationship, not worth worrying about. Instead we should be debating whether we want more or fewer government services relative to private goods.

All data used state-level rates as stored on the  web site http://www.usgovernmentrevenue.com maintained by Christopher Chantrill, self-described "writer and conservative".


I intentionally chose a strong title for this blog. My academic colleagues will reasonably argue that sales and income taxes DO have some dampening effect on a state economy. I do not disagree that there is some effect. But these graphs reveal that it is not detectable when it is realized that tax increases are used to pay for public services. For political decision-making, which of the following two statements is more nearly true? I would go with the latter.

Raising sales or income taxes by one percent in order to invest in bridges, public transit and education will have a meaningful negative effect on the state economy.

Raising sales or income taxes by one percent in order to invest in bridges, public transit and education will have a meaningful positive effect on the state economy.

Here are links to the previous three blogs on Taxes

#1 All Taxes and Budgets Should be Expressed as Dollars per Person

#2. Include Social Security and Medicare taxes when discussing tax burdens

#3 Tax Bads (or at least don’t subsidize them!)

#3 Tax Bads (or at least don’t subsidize them!)

Time to Change the Tax Discussion #3

This is the third in a five part series about taxes.

Introductory economics tells us that when the government taxes something, unless it is perfectly inelastically supplied or demanded, the tax will cause a distortion in a market and reduce the taxed activity. For most things (labor, profits, food, etc.) this reduction is considered a bad thing, and causes welfare losses. Yet taxes on BADS (i.e., goods with strong negative externalities) are welfare improving, since they reduce something that you want to reduce anyway.  Almost all economists will agree with this conceptually. Yet politicians and consumers are not forced to confront this reality. Perhaps economists could do a better job holding politicians accountable to this, by speaking out more. Here are six examples from recent policy debates. Why are economists not lining up behind these?

1. Tax the Sale of Guns.

The constitution asserts the right of people to own "arms" but says nothing about them being free or cheap. Econmists should favor taxing the sale of all guns, and even taxing the annual ownership of guns (similar to what we do for cars and housing) because of their large negative externalities. Higher taxes on more dangerous weapons (e.g. assault weapons), would also be appropriate. We could raise several billion dollars a year this way, and even earmark it for the extra medical care and law enforcement made necessary by the widespread ownership of guns. (In theory, I prefer not to earmark revenues, but history shows it is much easier to pass legislation if this is done, such as taxes on cigarettes. Hence in practice I support it.)

2. Tax Carbon

We will never have unanimous agreement that our excess carbon is a major cause of global warning, but we don't need to believe this unanimously to be willing to act on it. British Columbia (Canada) implemented a carbon tax in 2008 which is raising billions of dollars while nudging people to use less fuel. Look at two recent postings here

Climate Action Through a Tax Swap Describes a currrent initiative in Washington State to implement a state carbon tax. See numerous links within it.

More on BCs carbon tax shift. Posted in 2009 this discusses the reasons for the British Columbia's tax

3. Remove US Subsidies on Corn and Sugar

It is totally bizarre that at the same that we are thinking of taxing soft drinks for their sugar content, we are still spending billions on subsidizing corn (and hence high fructose corn syrup). US Department of Agriculture numbers show that in 2011 alone we spent 4.9 billion dollars subsidizing corn, which is  $16 per American. Visit the excellent website of  Environmental Working Group, which tracks agricultural subsidies and focus on Corn if you wish.

Remarkably, even farmers in Massachusetts benefit from the corn subsidy:

Corn Subsidies** in Massachusetts totaled $16.8 million from 1995-2011.

That works out to $4 per Massachusetts resident over 17 years. But the Massachusetts subsidy is nothing compared to Iowa which received

14.9 billion dollars ($4,866 per resident, or $286 per Iowa resident per year) over the same period. 2011 is not a particularly large outlier.

For further discussion of the serious problems with our crop insurance program consider this quote about US crop insurance.

"The most stunning evidence of the need to overhaul the current system is Dr. Babcock’s estimate that taxpayers
send $1 dollar to insurance companies and agents for every $1 dollar that goes to farmers."

Bruce Babcock "Giving It Away free: Free Crop Insurance Can Save Money and Strengthen the Farm Safety Net"
April 2012, (Professor of Economics at Iowa State University)

http://static.ewg.org/reports/2012/farm_bill/babcock_free_crop_insurance.pdf

4. Remove subsidies on US fossil fuel production, consumption, and depletion.

This follows from point #2 above. I know it is hard to do, but so is a Carbon Tax.

The surprising reason that Oil Subsidies Persist: Even Liberals Love them. Forbes, April 25, 2012.

We should not be subsidizing oil, coal and natural gas: 15.1 billion dollars in 2010 ($48 per American in 2010), according to OECD estimates.

5. Tax (more) people who do not purchase health insurance

As a health economist, I had to add at least one health related "bad".

The Affordable Care Act of 2010 includes provisions for taxing people who choose not to purchase health insurance, as it should, since they impose costs on the rest of us who do by: relying on charity care when they have emergency medical needs, relying on bankruptcy when they have high uninsured costs, and raising average premiums for insurance buyers since the people not buying insurance are on average healthier (and lower cost) than average. Hence this tax will be welfare improving, overall.

I thought about discussing/supporting taxes on obesity, smoking, or alcohol abuse, but see lots of problems with that, even those these are bads, often under the control of consumers.

6. Don't subsidize war

War is bad, and has a lot of negative externalities. (Yes, there are also some benefits.) In 2013 the US will spend $902 billion  on national defense (excluding police, fire, law and prisons). That is $2863 per American in 2013 alone on "defense". (Health and Education have mostly positive externalities.)

Brown University researchers maintain a web site on the cost of wars since 9/11

Here is one sobering sentence from a recent press release.

"The war bills already paid and obligated to be paid by the U.S. federal government as of fiscal year 2012 are $3.7 trillion in constant dollars."

That is $11,746 per US citizen...

There are many more bads that should be taxed and not subsidized, but I will end here.

For related discussion see the earlier blogs

#1 All Taxes and Budgets Should be Expressed as Dollars per Person

#2. Include Social Security and Medicare taxes when discussing tax burdens

Letter calls for gun injury research

Colleague Austin Frakt forwarded to me the link to an open letter to VP Joseph Biden and members of the Gun Violence Commission.

http://crimelab.uchicago.edu/sites/crimelab.uchicago.edu/files/uploads/Biden%20Commission%20letter_20130110_final.pdf

The letter is signed by over 100 well-known health professionals, policymakers and economists.

The letter addresses the fact that both teh CDC and the NIH agencies are currently prohibited from funding research on the health effects of guns.

Anyone serious about wanting to understand how to control gun violence should support the letter's two recommendations:

RECOMMENDATION ONE: We call for the removal of the current barriers to firearm-related
research, policy formation, evaluation and enforcement efforts.

RECOMMENDATION TWO: We call on the federal government to make direct investments in
unbiased scientific research and data infrastructure.

The following table in the letter tells the story clearly.

9 Branas, C., Wiebe, D., Schwab, C. & Richmond, T. (2005) Getting past the "f" word in federally funded public health research, Injury Prevention 11(3): 191.
10 http://projectreporter.nih.gov/reporter.cfm
11 Calculated updated numbers for 2002 -2012 for cholera and rabies using average case occurrences per year

Commonwealth Fund Report on Health Care Cost Control

The Commonwealth Fund has just come out with a new report outlining a strategy for containing health care costs in the US. It seems rather optimistic to me. Here is the opening two paragraphs and link.

Confronting Costs: Stabilizing U.S. Health Spending While Moving Toward a High Performance Health Care System, Authored by The Commonwealth Fund Commission on a High Performance Health System
January 10, 2013

Michael Chernew (Harvard) is the only economist on the Commission, which is mostly MDs and MBAs.

"Overview

The Commonwealth Fund Commission on a High Performance Health System, to hold increases in national health expenditures to no more than long-term economic growth, recommends a set of synergistic provider payment reforms, consumer incentives, and systemwide reforms to confront costs while improving health system performance. This approach could slow spending by a cumulative $2 trillion by 2023—if begun now with public and private payers acting in concert. Payment reforms would: provide incentives to innovate and participate in accountable care systems; strengthen primary care and patient-centered teams; and spread reforms across Medicare, Medicaid, and private insurers. With better consumer information and incentives to choose wisely and lower provider administrative costs, incentives would be further aligned to improve population health at more affordable cost. Savings could be substantial for families, businesses, and government at all levels and would more than offset the costs of repealing scheduled Medicare cuts in physician fees." from The Commonwealth Fund Report

The heart of their analysis is in the technical report by Actuarial Research Corp.

Jim Mays, Dan Waldo, Rebecca Socarras, and Monica Brenner "Technical Report: Modeling the Impact of Health Care Payment, Financing, and System Reforms" Actuarial Research Corporation, January 10, 2013

The areas they simulate are revealed in the table of content headings. Nice recent references.

Introduction .................................................................................................................................................. 1
I. Improved Provider Payment ................................................................................................................. 4
II. Primary Care: Medical Homes ............................................................................................................... 7
III. High-Cost Care Management Teams .................................................................................................. 13
IV. Bundled Payments .............................................................................................................................. 16
V. Modified Payment Policy for Medicare Advantage ............................................................................ 22
VI. Medicare Essential Benefits Plan ........................................................................................................ 26
VII. Private Insurance: Tightened Medical Loss Ratio Rules ...................................................................... 30
VIII. Reduced Administrative Costs and Regulatory Burden ...................................................................... 32
IX. Combined Estimates ........................................................................................................................... 35
X. Setting Spending Targets .................................................................................................................... 37
Appendix A. Creating the "Current Policy" Baseline ................................................................................... 40


Be Ready for the Trillion Dollar Coin!

In case you have not been paying attention, there is growing sentiment in favor of the Platinum Coin Seigniorage (PCS) and the Trillion Dollar Coin.

Here are two solid posts on it, one by economist Paul Krugman, the other by Philip Diehl, former director of the US mint .

The crux of the issue is that the debt ceiling,  created by legislation of our congress, is inconsistent with the powers enumerated in the constitution, specifically the fourteenth amendment.

Be Ready To Mint That Coin

http://krugman.blogs.nytimes.com/2013/01/07/be-ready-to-mint-that-coin/?smid=tw-NytimesKrugman&seid=auto

Co-author of platinum coin law weighs in on trillion dollar coin

http://www.dailykos.com/story/2013/01/08/1177211/-Co-author-of-platinum-coin-law-weighs-in-on-trillion-dollar-coin?detail=email

Here is the relevant sentence in section 4, of the 14th amendment of the US constitution.

Section 4. The validity of the public debt of the United States, authorized by law, including debts incurred for payment of pensions and bounties for services in suppressing insurrection or rebellion, shall not be questioned.

This amendment was passed in July 9, 1868 and "Section 4 confirmed the legitimacy of all United States public debt appropriated by the Congress." Wikipedia.

Here is the Wikipedia discussion of the issue, somewhat dated.

The issue of what effect Section 4 has regarding the debt ceiling remains unsettled.[52] Legal analyst Jeffrey Rosen has argued that Section 4 gives the President unilateral authority to raise or ignore the national debt ceiling, and that if challenged the Supreme Court would likely rule in favor of expanded executive power or dismiss the case altogether for lack of standing.[53] Erwin Chemerinsky, professor and dean at University of California, Irvine School of Law, has argued that not even in a "dire financial emergency" could the President raise the debt ceiling as "there is no reasonable way to interpret the Constitution that [allows him to do so]".[54]


1994 assault weapons ban may have saved 6000 lives per year

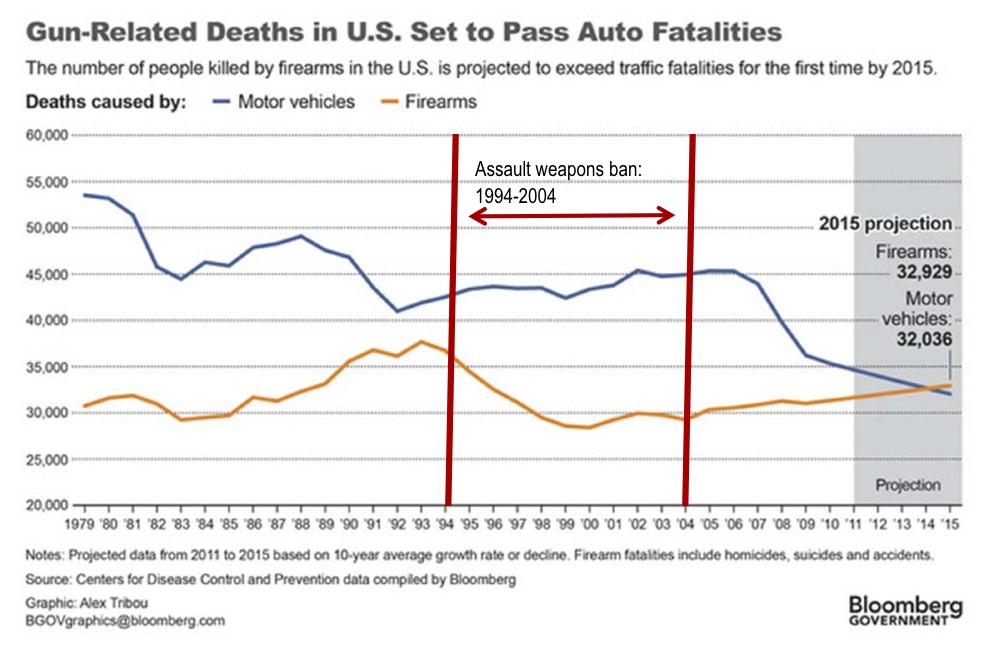
Although not a statistical statement, there is a noticeable association between when the 1994-2004 assault weapon ban was in place and the observed decline in gun-related deaths. That ban also contained other provisions that will have affected availability of guns.

A decline of more than 6000 gun-related deaths per year appears to be  associated  with that legislation before it expired. See linked picture.


Another articles on this issue also has compelling graphs. The title of the paper could be its abstract..

S Chapman, P Alpers, K Agho, M Jones. 2006. Australia’s 1996 gun law reforms: faster falls in firearm
deaths, firearm suicides, and a decade without mass shootings.
Injury Prevention 2006;12:365–372. doi: 10.1136/ip.2006.013714


Two Great Articles in the December JEL

Journal of Economic Literature, December 2012

Two great articles.

Racial Discrimination in the Labor Market: Theory and Empirics

Kevin Lang and Jee-Yeon K. Lehmann

We review theories of race discrimination in the labor market. Taste-based models can generate wage and unemployment duration differentials when combined with either random or directed search even when strong prejudice is not widespread, but no existing model explains the unemployment rate differential. Models of statistical discrimination based on differential observability of productivity across races can explain the pattern and magnitudes of wage differentials but do not address employment and unemployment. At their current state of development, models of statistical discrimination based on rational stereotypes have little empirical content. It is plausible that models combining elements of the search models with statistical discrimination could fit the data. We suggest possible avenues to be pursued and comment briefly on the implication of existing theory for public policy. (JEL J15, J31, J64, J71)
Wonderful synthesis from Kevin and Lehmann, a recent BU Ph.D. alum.

Full-Text Access | Supplementary Materials 

Psychologists at the Gate: A Review of Daniel Kahneman's Thinking, Fast and Slow

Andrei Shleifer

The publication of Daniel Kahneman's book, Thinking, Fast and Slow, is a major intellectual event. The book summarizes, but also integrates, the research that Kahneman has done over the past forty years, beginning with his path-breaking work with the late Amos Tversky. The broad theme of this research is that human beings are intuitive thinkers and that human intuition is imperfect, with the result that judgments and choices often deviate substantially from the predictions of normative statistical and economic models. In this review, I discuss some broad ideas and themes of the book, describe some economic applications, and suggest future directions for research that the book points to, especially in decision theory. (JEL A12, D03, D80, D87) 

Nice short summary of key themes from the extraordinary Kahneman book.

Full-Text Access | Supplementary Materials

#2 Include Social Security and Medicare taxes when discussing tax burdens

Time to Change the Tax Discussion #2

This is the second in a five part series on Taxes.

Far too much of the discussion of tax burdens has focused on the federal income tax rates while the federal payroll taxes - Social Security and the Medicare tax - get minor attention. This was epitomized by Mitt Romney's reference to 47 percent of Americans as not paying any taxes, when what he meant was not paying any Federal income taxes. This line of discussion ignores the fact that low income earners pay Social Security and Medicare taxes. Almost every economist would agree that these payroll taxes affect net pay and incentives in fundamentally the same way as income taxes and hence matter greatly. While true that these are earmarked taxes, they are nonetheless important contributions to federal revenue and affect deficits. In 2012 The federal income tax contributed 32 percent of total federal revenue, while social security and medicare payroll taxes contributed 23.9 percent.  Since these social insurance taxes are either proportional (Medicare tax) or regressive (SSI, since it stops after $110,000 in 2012), they substantially change the overall progressivity of the taxes. the following figure is from the Concord Coalition, based on US Treasury data.

https://spreadsheets.google.com/spreadsheet/oimg?key=0AqDf7XX8MI2BcGVxYmhHME92YWgtTXQ1bm84YTlpZkE&oid=2&zx=n74qil40ph5k

U.S. Treasury Department, Final Monthly Treasury Statement from Sept. 2012

http://www.concordcoalition.org/learn/budget/federal-budget-pie-charts

In an earlier blog (What are current marginal tax rates?), I calculated marginal tax rates for various levels of taxable income, which show that currently people earning $70,700 to $142,700 pay the highest marginal tax rates (38.1% including federal, SSI and Medicare taxes, higher if you add in Massachusetts income taxes).Warren Buffett basically referred to this same phenomenon when he said that his secretary paid higher taxes than he does on earned income.

Allowing the Bush tax cuts to expire will return those earning over $388,350 to paying the highest marginal rates (43.4% including the Medicare and ACA taxes).

For related discussion see the earlier blogs

#1 All Taxes and Budgets Should be Expressed as Dollars per Person

#2. Include Social Security and Medicare taxes when discussing tax burdens