Category Archives: General Economics

The US Should Ban or Heavily Tax Weapons Designed for Mass Shootings

Boston University Working Paper

Randall P. Ellis
Boston University,
Department of Economics
August 22, 2016
Abstract

This paper presents four arguments for why the US should ban or at least heavily tax the sale or transfer to civilians of weapons designed for mass shootings (WDMS), which would include most semi-automatic guns and weapons with large capacity magazines.

  1. The Supreme Court has repeatedly validated that second amendment protections of the right to bear arms do not apply to particularly dangerous weapons where protection of public safety overrides constitutional protections; this exclusion should apply to WDMS just as it does to machine guns and short-barreled shotguns.
  1. To make gun owners pay for the annual cost of deaths in the US due to guns, we should be taxing each gun owned at $1000 per year, or tax all gun sales (new or used) at $15,000 per gun sold. Given their higher killing power we should tax WDMS at $60,000 per gun sold. Or just ban them.
  1. In the last 36 months, there have been 5,399 people in the US killed or injured at mass shootings (where four or more people are shot, although not necessarily killed). Unless action is taken, the most recent trends suggest that there will be twice as many mass shootings in the US in five years.
  1. Current federal law for duck hunting bans the use of shotguns that hold more than three shells. If we care enough to ban four-bullet capacity guns to preserve ducks, then we should be willing to ban even higher capacity guns designed to kill people.

The full paper is linked here.

http://blogs.bu.edu/ellisrp/files/2016/08/Banning-or-heavily-taxing-WDMS-20160822.pdf

Obama’s JAMA article is a must read for all professionals

There is a very important  article in this week’s JAMA - Internal Medicine, written by Barach Obama.

It highlights the effects of the ACA/Obamacare.  It is free on-line.

United States Health Care Reform: Progress to Date and Next Steps

http://jama.jamanetwork.com/article.aspx?articleid=2533698

If you are short on time, then the following link to just the figures provides many of the key results.

http://jama.jamanetwork.com/article.aspx?articleid=2533698

To me the highlights of the article are that it documents:

The decline in the uninsured (no surprise, but well presented) now down to 9.1 percent from over 16
Declines in teen smoking from 19.5% to 10.8% due to the Tobacco Control Act of 2009 (Wow)
Much slower rates of decline in the uninsured in states that refused the Medicaid expansion (no surprise)
The decline in the underinsured among privately insured as measured by the near disappeance of unlimited exposure (new to me)
Lower rates of individual debt sent to a collection agency (great to see)
Negative rates of real cost growth in Medicare and Medicaid since 2010, with drastically lower growth in privately Insured
Constant share of out of pocket spending as a fraction of total spending among the employer based insurance
(new to me, he cites increases in deductibles offset by decreases in copays and coinsurance.)
Forecast Medicare spending in 2019 is now 20% LOWER than when he took office.
Decline in Medicare 30 day, all hospital readmission rates as well as improvements in other measures.
This information is important to understand to counter the repeated false claims that Obamacare is a failure, or has increased health care spending, or is bankrupting the government, all of which are shown to be false in the evidence presented here.

Here is the link again.

http://jama.jamanetwork.com/article.aspx?articleid=2533698

Press Interviews and Quotes

Partly just to keep track of them for my BU annual report, this post links to my press interviews and quotes.

Meeting basic needs under Trump

Fed funds key for landlords, affordable tenants; Trump’s health secretary opposes Obamacare

Bay State Banner Jule Pattison-Gordon | 12/7/2016, 1:13 p.m.

Effects of Brexit on the world economy and Iran.

Tasnim News Agency Interview, Iran (translated into Persian), June 28, 2016.

Farm Animal Ballot Initiative.

posted on Youtube. By  Brittany Comak, BU School of Communication. November 29, 2015

Inspector General criticizes Red Sox, BRA deal

Massachusetts Inspector General Glenn Cunha criticized a 2013 deal by Boston Redevelopment Authority that granted the Boston […]

by · October 29, 2015 · 0 comments · City, News
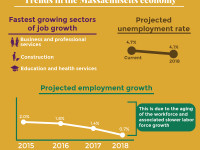
According to a New England Economic Partnership report released Thursday, Massachusetts is creating jobs at the fastest pace in 15 years. GRAPHIC BY KATELYN PILLEY/DAILY FREE PRESS STAFF

Mass. experiencing economic boom, study finds

In the past year, Massachusetts has seen an economic boom unlike any since the 1990s, a […]

by · October 20, 2015 · 0 comments · City, News
Massachusetts Gov. Charlie Baker signed a bill Friday authorizing $200 million in transportation funds. PHOTO BY STUX/PIXABAY

$200 million in extra funding approved for infrastructure repairs

Massachusetts Gov. Charlie Baker approved an additional $200 million in funding for infrastructure contributing to a […]

by · April 14, 2015 · 0 comments · City, News
Massachusetts lawmakers announced their support Friday for a bill that would allow the legalization and taxation of marijuana. PHOTO BY SARAH SILBIGER/DAILY FREE PRESS STAFF

Mass. lawmakers support bill that would legalize and tax marijuana

Fifteen Massachusetts lawmakers are supporting a bill, pushed by the Marijuana Policy Project, that would regulate […]

by · March 18, 2015

MBTA late-night service threatened by lack of sponsorship Daily Free Press. by Paige Smith · January 27, 2015

Part time BU employees now eligible for health, dental benefits Daily Free Press. by Rachel Legon · October 30, 2014

Student loan report shows complaints, problems with private lenders Daily Free Press by Meiling Bedard · October 21, 2014

Greater Boston GDP declining, report finds Daily Free Press. by Mina Corpuz  September 18, 2014

Small businesses get extension for ACA in Massachusetts by Daily Free Press Admin · April 27, 2014

STUDY: Grad student loan debt on the rise. by Daily Free Press Admin · March 26, 2014 

College worthwhile investment, study suggests by Daily Free Press Admin · February 26, 2014

Bitcoin ATM installed in South Station by Daily Free Press Admin · February 23, 2014

Cost of student loan programs difficult for federal government to determine, study suggests  by Daily Free Press Admin · February 4, 2014

Universities see an increase in endowments, study suggests by Daily Free Press Admin · January 29, 2014

"South Shore Hospital, Partners HealthCare defend merger plan" The Patriot Ledger. by Christian Schiavone.  1/17/2014

"The Healing Begins for Healthcare.gov"  TechNewsWorld By Erika Morphy 12/04/13 4:12 PM PT

"Financial squeeze awaits W.Pa. hospitals", TribLive. By Alex Nixon. Thursday, Oct. 24, 2013.

"Wenermaar aan, Obamacare blijft", Trouw Buitenlandredactie. (Article on ObamaCare in Dutch Newspaper) In Dutch. October 4. 2013

Menino plans to build about 30,000 housing units by 2020. Daily Free Press, Boston University, Sep 11, 2013

"Boston welcomes startups, entrepreneurship, despite study results" Daily Free Press, Boston University, Sep 11, 2013

Mass. residents driving less since 2004, study suggests. Daily Free Press, Boston University, Sept 4, 2013.

Medical Costs Register First Decline Since 1970s. Wall Street Journal Blog.  June 18, 2013,

Employers fear economic climate, fail to make hires, new study suggests. Daily Free Press, Boston University, April 24, 2013.

Outside spending in Senate race tops $1.25 million. Daily Free Press, Boston University, April 9, 2013.

New delayed-start loan repayment plan may help grads.Daily Free Press, Boston University, April 3, 2013.

Years after recession, Mass. job numbers finally bounce back. Daily Free Press, Boston University, April 2, 2013.

Popeye’s President Unconcerned About Obamacare, Says Health Insurance ‘Just Not Affordable’ Huffington Post. March 28th, 2013

Tax-based aid needs reform, report suggests. The Daily Free Press. Boston University. Feb 27, 2013.

Minimum wage-earners face hardship paying rent. The Daily Free Press, Boston University, Feb 5, 2013

Gas prices in Mass. shoot up 14 cents a gallon. The Daily Free Press, Boston University. Feb 5, 2013

Freshmen see college as necessary to riches, study suggests. The Daily Free Press, Boston University. Jan 30, 2013.

College debt high despite lower credit card, general debt. The Daily Free Press, Boston University. Dec 3, 2012

Government officials demand sales tax for items bought online. The Daily Free Press, Boston University. Nov 27, 2012

Interview with ASHEcon President Randy Ellis. American Society of Health Economists (ASHEcon) Newsletter Vol. 4 Fall 2010.


Hillary Clinton’s Memorial Day speech 2016 will be a classic.

My previous post was discouraging in that it was all about the techniques Donald Trump is using to build support. This one is much more upbeat.

I had heard about but not actually watched or listened to Hillary Clinton's Memorial day speech, which has been getting a lot of favorable reviews. I just finished listening to it while checking email and it was indeed very inspiring, hopeful, and the best speech year from Hillary. I recommend it very highly, even if it is 34 minutes long. Here is one link from the Daily Kos on which you can watch or listen to the entire speech.

http://www.dailykos.com/story/2016/6/2/1533764/-The-PRESS-responds-to-Hillary-s-EPIC-speech-today-and-it-is-awesome

I also like that they post links to how it was received from various sites. Choose your favorite one to get a perspective.

If enough voters could watch this clip, it would change the entire discussion.


Sobering Scott Adams interview about Trump on Real Time

This email will interest people who are closely following the US presidential election.

I invite you to watch the following four minute video on Trump and Hillary when you have time. It changed my thinking.

On the Friday June 2  Real Time with Bill Mayer, Scott Adams (who is the genius creator of the Dilbert comic strip) gave a very sober assessment of why Trump has been so successful. Adams is a trained hypnotist and has written several books on the art of persuasion.  Adams has a blog and LAST SUMMER he predicted Trump would win by a landslide. This, plus his careful comments were very real to me. According to Adams, Trump is not a fool, but rather he is a high IQ master persuader.

The Real Time clip was taken down on YouTube, where they want you to subscribe to Real Time, but it is still linked here.

http://lastnighton.com/2016/05/31/dilbert-creator-tells-bill-maher-why-trump-will-win-election/

Here is a link to his the Scott Adams blog.

http://blog.dilbert.com/tagged/RealTime

Here is  a link to his October 2015 blog where he predicted Trump will win in a landslide.

http://blog.dilbert.com/post/131749156346/the-case-for-a-trump-landslide-part-1

Here are the first three sentences from this blog from last October

“The latest poll out of Iowa shows Carson ahead of Trump. And you know what that means?

It means Iowa is about to become irrelevant. Here I am assuming evangelicals will band together to give Carson the win in Iowa before Trump goes on to run the table everywhere else.”

I also liked this review from the Washington Post in March 2016. It summarizes the six principles Trump is using to win.

https://www.washingtonpost.com/news/comic-riffs/wp/2016/03/21/donald-trump-will-win-in-a-landslide-the-mind-behind-dilbert-explains-why/

Here are his principles in list form.

  1. Trump knows people are basically irrational.
  2. Knowing that people are irrational, Trump aims to appeal on an emotional level.
  3. By running on emotion, facts don’t matter.
  4. If facts don’t matter, you can’t really be “wrong.”
  5. With fewer facts in play, it’s easier to bend reality.
  6. To bend reality, Trump is a master of identity politics — and identity is the strongest persuader.

Here are the final lines from that Washington Post article.

Writes Adams: “Identity is always the strongest level of persuasion. The only way to beat it is with dirty tricks or a stronger identity play. … [And] Trump is well on his way to owning the identities of American, Alpha Males, and Women Who Like Alpha Males. Clinton is well on her way to owning the identities of angry women, beta males, immigrants, and disenfranchised minorities.

“If this were poker, which hand looks stronger to you for a national election?”

http://lastnighton.com/2016/05/31/dilbert-creator-tells-bill-maher-why-trump-will-win-election/

Watch the Real Time interview. And think about how you can get your favorite politician - local, state or national - to be better at persuasion and the use of modern media.

Randy

Congratulations to BU’s Class of 2016 Economics graduates!

Please celebrate the students who earned 498 Boston University degrees in Economics at Commencement this May.

This year the program mentions:

22 Ph.D. recipients

203 Master’s degree recipients (MA, MAPE, MAEP, MAGDE MA/MBA, BA/MA)

273 BA recipients (including BA/MA)

This total of 498 degrees is up from 482  in 2015.

These numbers undercount the total for the year since it may exclude students who graduated in January 2016 and chose not to appear at Commencement.

The number of graduate degree recipients 225 is way up from last year when we had 177, with most of the growth in MAs.

In 2015 there were 22 PhDs, 155 Master's degree recipients, and 305 BA recipients.

In 2014 there were 17 PhDs, 207 Master’s degree recipients, and 256 BA recipients.

Altogether 24 Ph.D. students obtained jobs this year (versus 19 last year).

To see the Ph.D. placements visit the web site linked here.

http://www.bu.edu/econ/gradprgms/phd/placements/

The department’s  website now lists 38 regular faculty (down two from last year) with titles of assistant, associate or full professors, a number which is two below the number of professors in 2012.

http://www.bu.edu/econ/people/faculty/


Congratulations to all!

Top 100 Economics Blogs of 2016

I just got an email from Prateek Agarwal <prateek@intelligenteconomist.com>

He has compiled a list of the Top 100 Economics Blogs of 2016. I am of course not on it since I blog infrequently and do not archive (and make public) on my web site all of my blogs, but I thought I would share the link he provided.

https://www.intelligenteconomist.com/top-economics-blogs-2016/

Lots of interesting links, including The Incidental Economist, which is the only one I subscribe to. Be warned that reading blogs can be a major time waster..

I plan to archive this one on my web site blog.

Hope to see many of you at ASHEcon. (Not too late to sign up for the dinner)

Best.

24 BU economics Ph.D.s accept jobs in academic, government and private sectors

Congratulations to the 24 current or recent Ph.D. students from BU Economics who have accepted jobs for this September. Recent placements from the department are linked here, as well as pasted below.

http://www.bu.edu/econ/phd/outcomes/placements/

This year candidates selected 14 academic jobs, five government or central bank jobs, and five private sector jobs for their initial placement.

Everyone formally on the market this year accepted  a job offer.

Thank you, BU colleagues and outside letter writers, for your help with them getting a job.
Let me also thank the five BU staff members who helped with the application process:
Gillian Gurish, Norma Hardeo, Miriam Hatoum, Deb Kasabian, Gloria Murray.
Special thanks to Gillian Gurish for her excellent web page support to the job seekers.

Randy Ellis, Economics department placement officer

2016 PhD Placements

Economics PhD Accepted Job Offers

Amazon, Seattle, WA Jiaxuan Li
Amazon, Seattle, WA Fan Zhuo
Bank of Canada, Ottawa, Canada Guihai Zhao
Central Bank of Chile, Financial Policy Division, Chile (senior economist)  J. Felipe Cordova
Central Bank of Chile, Chile Patricio Toro
Columbia University, Graduate School of Business, NY (post doc), then Federal Reserve Bank, Board of Governors, DC Levent Altinoglu
Cornerstone Research, Boston MA Francois Guay
Cornerstone Research, Chicago IL Kavan Kucko
Duke University, Sanford School of Public Policy, Raleigh NC (post doc) Matt Johnson
ECARES, Universite Libre de Bruxelles, Belgium (post doc) Ben Solow
Ernst & Young, NYC Mengmeng Li
Harvard Medical School, Department of Health Care Policy, Boston MA (asst. prof.) Tim Layton
Harvard Medical School, Mass General Hospital, Disparities Research Unit, Boston MA (lecturer/research scientist) Ye Wang
Harvard Medical School, Mass General Hospital, Disparities Research Unit, Boston MA (post doc) Mirk Fillbrunn
Holy Cross, MA (visiting asst. prof.) Dan Schwab
London School of Economics, Department of Social Policy and   Imperial College, School of Public Health, Health Economics Group, London UK (joint position, post doc) Sara Machado
Peking University, Marketing, Guanghua School of Management, China (asst. prof.) Ying Lei
Reserve Bank of India, Center for Advanced Financial Research and Learning, Mumbai India (research director) Apoorva Javadekar
Shanghai University of Finance and Economics, School of Economics, China (asst. prof.) Yao Shu
Shanghai University of Finance and Economics, School of Finance, China (asst. prof.) Ei Yang
Texas A&M, Department of Political Science, TX (asst. prof.) Benjamin Ogden
US Census Bureau, Center for Economic Studies, MD Elisabeth Perlman
Wellesley College, Department of Economics, MA (lecturer) Alex Poterack
Xiamen University, Department of Economics and Wang Yanan Institute for Studies in Economics (WISE), China (asst. prof.) Shuheng Lin

What do BU undergraduates do when they graduate?

I am often asked by undergrads and MA students what BU students do when they graduate. For the first time that I know of, BU has published a relatively complete description and list of the places where they get jobs, or go to graduate school or  volunteer.  It is discussed in the new CAS Dean Ann Cudd's newsletter which is linked here.

A Note from Dean Cudd: Preparing our Undergraduates for the ‘Real World’

Of particular interest is the pdf file listing where undergrads are working and what their job title is.

CLASS OF 2014: Post-Graduation First Destination Profile

From now on, this list will be one of the first places I suggest undergrad job seekers look for possibilities in the US, abroad, and to consider BU alumni to network with.

In addition to being their placement officer, I help maintain the list of recent BU placements of our Ph.D. students which is linked here.

Recent Ph.D. job placements.

By the way, it is also not too late for alumni from our Ph.D. program to interview and hire our candidates on the job market. (Another impressive group.) They are linked here.

Current Ph.D. job candidates.

Separately, in the last two days, I met with one undergraduate and two MA students during office hours, all who happened to be from China.  All three said that the BU program was much harder than the courses their friends were taking elsewhere as undergraduates or Master's students. While they were in part complaining about too much work at BU, all of them were also grateful that they are getting a solid education and being challenged. It makes it a good investment. I told them to tell their friends in China and elsewhere. It also made me feel proud that BU has not succumbed to  the rampant grade inflation and work deflation that is common elsewhere.

Randy


Denmark’s Social Capitalism and Switzerland’s Federal Democracy

With Democratic presidential candidates Hillary Clinton and Bernie Sanders both mentioning Democratic Socialism in Denmark, it is interesting to read about what it actually is.

Here is one link with one persons discussion.

Denmark sounds pretty wonderful to me

Switzerland

I just returned from Switzerland which is not democratic socialism, but rather a federalist direct democracy centered on capitalism much like the US.

The Swiss seem to be doing many things right.

SOLOTHURN

The small city of Solothurn (pop 16,000) we stayed at had the following features. (Based on my visit, augmented by https://en.wikipedia.org/wiki/Solothurn)

A train, at least six bus lines and an electric trolley - for a city of 16,000!

Trains that runs on weekends almost as regularly as weekdays. Twice an hour on its two lines on Sunday mornings.

Hundreds (thousands?) of locals from the town using trains to get to the local cable car and go for hikes in the Alps on a Sunday morning in November.

23% foreign national residents

No driving in the center of the city. Only pedestrians or local residents and deliveries.

At least seven museums: art museum, rock carving museum, castle arsenal museum, nature museum, pinball museum, puppet museum, history museum

Trash containers every 100 feet along most public sidewalks.

Two pedestrian-only bridges across the Aare river (good crossword answer)

Bicycle parking for over 100 bikes at the train station.

No large supermarkets or malls that I saw.


WORK?

Unemployment rate of 4.6% in 2010.

Minimum wage of $20 to $25 depending on canton. In May a national referendum to raise it to the equivalent of $24.70 narrowly failed.

Only 40.3% of the people use a car to get to work (40% walk or ride a bike, while 20% use public transport).

Considered the richest country in the world.


TAXES?

Median tax rate for a single person earning > $150,000 is 22% in 2011.

8% value added tax (national) plus a canton rate.

.3 to .5% property tax (national) (notice the decimal point)

Corporate profit tax of 8.5 (national) with some more by cantons (= states)

Overall fiscal rate for Switzerland was 38.5% in 2002.

Health (from Wikipedia on 11/12/15) https://en.wikipedia.org/wiki/Switzerland

Swiss citizens are universally required to buy health insurance from private insurance companies, which in turn are required to accept every applicant. While the cost of the system is among the highest it compares well with other European countries in terms of health outcomes; patients who are citizens have been reported as being, in general, highly satisfied with it.[151][152][153] In 2012, life expectancy at birth was 80.4 years for men and 84.7 years for women[154] — the highest in the world.[155][156] However, spending on health is particularly high at 11.4% of GDP (2010), on par with Germany and France (11.6%) and other European countries, and notably less than spending in the USA (17.6%).[157] From 1990, a steady increase can be observed, reflecting the high costs of the services provided.[158] With an ageing population and new healthcare technologies, health spending will likely continue to rise.[158]


Like Denmark, Switzerland seems to run on trust.

This all sounds pretty attractive to me. Why can’t we look at successes in Europe more and imitate them?

Tax to rise on the uninsured next year.

This is why enrollment in health insurance will continue to rise in the US from the ACA.

For 2016: Max of  $695 or 2.5 percent of taxable income if uninsured.

http://www.bostonglobe.com/news/nation/2015/10/19/health-law-fine-uninsured-will-more-than-double/76FbuARARxAmaT9H4nN66K/story.html

Full text is below.

Health law fine for uninsured to rise

Boston Globe

Associated Press  October 19, 2015

WASHINGTON — The federal penalty for having no health insurance is set to jump to $695, and the Obama administration is being urged to highlight that fact in its new pitch for health law signups.

That means the 2016 signup season starting Nov. 1 could see penalties become a bigger focus for millions of people who have remained eligible for coverage but uninsured. They’re said to be squeezed for money and skeptical about spending what they have on health insurance.

Until now, health overhaul supporters have stressed the benefits: taxpayer subsidies that pay about 70 percent of the monthly premium, financial protection against sudden illness or an accident, and access to regular preventive and follow-up medical care.

But in 2016, the penalty for being uninsured will rise to the greater of either $695 or 2.5 percent of taxable income. That’s for someone without coverage for a full 12 months. This year the comparable numbers are $325, or 2 percent of income.

Marketing usually involves stressing the positive. Rising penalties meet no one’s definition of good news. Still, that may create a new pitch:

The math is pretty clear. A consumer would be able to get six months or more of coverage for $695, instead of owing that amount to the IRS as a tax penalty. (That is based on subsidized customers now putting in an average of about $100 a month of their own money.)”

BU ranked 41 overall, 24th in Economics, by US News and World Report

Since I have blogged about rankings in the past - here and here, I thought I would blog about BU's latest rankings by US News and World Report and elsewhere.

BU was ranked 41, up one position in the 2015 as top US Colleges and Universities.

This ranking is across all fields, and is based mostly on survey results.

BU rankings in various subsets by USN&WR are linked here.

In Economics, BU was only ranked #24 by USN&WR, tied with Johns Hopkins, and just behind Brown, CMU, Duke, Maryland, Rochester.

This lower than hoped ratings of the department is not so surprising if you look at the USN&WR methodology:

“Rankings of doctoral programs in the social sciences and humanities are based solely on the results of peer assessment surveys sent to academics in each discipline.”

Peer assessments tend to change very slowly over time and our image before 2000 still enters into peoples ranking.

Economics had a 25 percent response rate from the department heads and directors of Graduate studies to whom they sent questionnaires.

BU tends to do better when using citations (currently ranked 12 by REPEC in the US behind Yale, Brown and Michigan, but ahead of U. Penn)

Another ranking is by QS World Universities where we are ranked 18 in the US 47th in the world, just behind Duke, Michigan, UCSD and Brown.

“The rankings highlight the world’s top universities in 36 individual subjects, based on academic reputation, employer reputation and research impact (full methodology here)”

The AEA own list of rankings, features several older ones.

Congratulations to BU’s Class of 2015 Economics graduates!

Please celebrate the students who earned 482 Boston University degrees in Economics at Commencement over the weekend. This year the program contained:

22 Ph.D. recipients

155 Master's degree recipients (MA, MAPE, MAEP, MAGDE MA/MBA, BA/MA)

305 BA recipients (including BA/MA)

This represents a total of 482 degrees! Up from 463 in 2014.

These numbers undercount the total for the year since it may exclude students who graduated in January 2014 and chose not to appear at Commencement.

The number of graduate degree recipients (177) is down from last year when we had 234.

Last year (2014) there were 17 PhDs, 207 Master's degree recipients, and 256 BA recipients.

Altogether 19 Ph.D. students obtained jobs this year (versus 23 last year). This is an undercount since some obtained jobs directly. To see the Ph.D. placements visit the web site linked here.

http://www.bu.edu/econ/gradprgms/phd/placements/

The department's  website now lists 40 regular faculty (up two) with titles of assistant, associate or full professors, a number which matches 2012.
http://www.bu.edu/econ/people/faculty/

Congratulations to all!

Ellis SAS tips for experienced SAS users

If you are a beginning SAS programmer, then the following may not be particularly helpful, but the books suggested in the middle may be. BU students can obtain a free license for SAS to install on their own computer if it is required for a course or research project. Both will require an email from an adviser. SAS is also available on various computers in the economics department computer labs.

I also created a Ellis SAS tips for new SAS programmers.

I do a lot of SAS programming on large datasets, and thought it would be productive to share some of my programming tips on SAS in one place. Large data is defined to be a dataset so large that it cannot be stored in the available memory. (My largest data file to date is 1.7 terabytes.)

Suggestions and corrections welcome!

Use SAS macro language whenever possible;

It is so much easier to work with short strings than long lists, especially with repeated models and datasteps;

%let rhs = Age Sex HCC001-HCC394;


Design your programs for efficient reading and writing of files, and minimize temporary datasets.

SAS programs on large data are generally constrained by IO (input output, reading from your hard drives), not by CPU (actual calculations) or memory (storage that disappears once your sas program ends). I have found that some computers with high speed CPU and multiple cores are slower than simpler computers because they are not optimized for speedy hard drives. Large memory really helps, but for really huge files it can almost almost be exceeded, and then your hard drive speeds will really matter. Even reading in and writing out files the hard drive speeds will be your limiting factor.

This implication of this is that you should do variable creation steps in as few datastep steps as possible, and minimize sorts, since reading and saving datasets will take a lot of time. This requires a real change in thinking from STATA, which is designed for changing one variable at a time on a rectangular file. Recall that STATA can do this efficiently since it usually starts by bringing the full dataset into memory before doing any changes. SAS does not do this, one of its strengths.

Learning to use DATA steps and PROC SQL is the central advantage of an experienced SAS programmer. Invest, and you will save time waiting for your programs to run.

Clean up your main hard drive if at all possible.

Otherwise you risk SAS crashing when your hard drive gets full. If it does, cancel the job and be sure to delete the temporary SAS datasets that may have been created before you crashed. The SAS default for storing temporary files is something like

C:\Users\"your_user_name".AD\AppData\Local\Temp\SAS Temporary Files

Unless you have SAS currently open, you can safely delete all of the files stored in that directory. Ideally, there should be none since SAS deletes them when it closes normally. It is the abnormal endings of SAS that cause temporary files to be saved. Delete them, since they can be large!

Change the default hard drive for temporary files and sorting

If you have a large internal secondary hard drive with lots of space, then change the SAS settings so that it uses temp space on that drive for all work files and sorting operations.

To change this default location to a different internal hard drive, find your sasv9.cfg file which is in a location like

"C:\Program Files\SASHome\x86\SASFoundation\9.3\nls\en"

"C:\Program Files\SASHome2-94\SASFoundation\9.4\nls\en"

Find the line in the config firl that starts -WORK and change it to your own location for the temporary files (mine are on drive j and k) such as:

-WORK "k:\data\temp\SAS Temporary Files"

-UTILLOC "j:\data\temp\SAS Temporary Files"

The first one is where SAS stores its temporary work files such as WORK.ONE where you define the ONE such as by DATA ONE;

The second line is where SAS stores its own files such as when sorting a file or when saving residuals.

There is a reason to have the WORK and UTIL files on different drives, so that it is in generally reading in from one drive and writing out to a different one, rather than reading in and writing out on the same drive. Try to avoid the latter. Do some test on your own computer to see how much time you can save by switching from one drive to another instead of only using one drive.

Use only internal hard drives for routine programming

Very large files may require storage or back up on external hard drives, but these are incredibly slow. External drives are three to ten times slower than an internal hard drive. Try to minimize their use for actual project work. Instead, buy more internal drives if possible. You can purchase additional internal hard drives with 2T of space for under $100. You save that much in time the first day!

Always try to write large datasets to a different disk drive than you read them in from.

Do some tests copying large files from c: to c: and from C: to F: You may not notice any difference until the file sizes get truly huge, greater than your memory size.

Consider using binary compression to save space and time if you have a lot of binary variables.

By default, SAS stores datasets in  a fixed rectangular dataset that leaves lots of empty space when you use integers instead of real numbers. Although I have been a long time fan of using OPTIONS COMPRESS=YES to save space and run time (but not CPU time) I only recently discovered that

OPTIONS COMPRESS=BINARY;

is even better for integers and binary flags when they outnumber real numbers. For some large datasets with lots of zero one dummies it has reduced my file size by as much as 97%! Standard variables are stored as 8 bytes, which have 8*256=2048 bits. In principle you could store 2000 binary flags in the space of one real number. Try saving some files on different compression and see if your run times and storage space improve. Note: compression INCREASES files size for real numbers! It seems that compression saves space when binary flags outnumber real numbers or integers;

Try various permutations on the following on you computer with your actual data to see what saves time and space;

data real;           retain x1-x100 1234567.89101112; do i = 1 to 100000; output; end;run; proc means; run;

data dummies; retain d1-d100 1;                                do i = 1 to 100000; output; end; proc means; run;

*try various datasteps with this, using the same or different drives. Bump up the obs to see how times change.


Create a macro file where you store macros that you want to have available anytime you need them. Do the same with your formats;

options nosource;
%include "c://data/projectname/macrofiles";
%include "c://data/projectname/allformats";
options source;

Be aware of which SAS procs create large, intermediate files

Some but not all procs create huge temporary datasets.

Consider: PROC REG, and PROC GLM generates all of the results in one pass through the data unless you have an OUTPUT statement. Then they create large,uncompressed, temporary files that can be a multiple of your original file sizes. PROC SURVEYREG and MIXED create large intermediate files even without an output statement. Plan accordingly.

Consider using OUTEST=BETA to more efficiently create residuals together with PROC SCORE.

Compare two ways of making residuals;

*make test dataset with ten million obs, but trivial model;

data test;
do i = 1 to 10000000;
retain junk1-junk100 12345;  * it is carrying along all these extra variables that slows SAS down;
x = rannor(234567);
y = x+rannor(12345);
output;
end;

Run;    * 30.2 seconds);
*Straightforward way; Times on my computer shown following each step;
proc reg data = test;
y: model y = x;
output out=resid (keep=resid) residual=resid;
run;  *25 seconds;
proc means data = resid;
run;  *.3 seconds;

*total of the above two steps is 25.6 seconds;

proc reg data = test outest=beta ;
resid: model y = x;
run;                     *3.9 seconds;
proc print data = beta;
run;  *take a look at beta that is created;
proc score data=test score=beta type=parms
out=resid (keep=resid) residual;
var x;
run;       *6 seconds!;
proc means data = resid;
run;  .3 seconds;

*total from the second method is 10.3 seconds versus 25.6 on the direct approach PLUS no temporary files needed to be created that may crash the system.

If the model statement in both regressions is

y: model y = x junk1-junk100; *note that all of the junk has coefficients of zero, but SAS does not this going in;

then the two times are

Direct approach:    1:25.84
Scoring approach:  1:12.46 on regression plus 9.01 seconds on score = 1:21.47 which is a smaller savings

On very large files the time savings are even greater because of the reduced IO gains; SAS is still able to do this without writing onto the hard drive in this "small" sample on my computer. But the real savings is on temporary storage space.

Use a bell!

My latest addition to my macro list is the following bell macro, which makes sounds.

Use %bell; at the end of your SAS program that you run batch and you may notice when the program has finished running.

%macro bell;
*plays the trumpet call, useful to put at end of batch program to know when the batch file has ended;
*Randy Ellis and Wenjia Zhu November 18 2014;
data _null_;
call sound(392.00,70); *first argument is frequency, second is duration;
call sound(523.25,70);
call sound(659.25,70);
call sound(783.99,140);
call sound(659.25,70);
call sound(783.99,350);
run;
%mend;
%bell;

Purchase essential SAS programming guides.

I gave up on purchasing the paper copy of SAS manuals, because they take up more than two feet of shelf space, and are still not complete or up to date. I find the SAS help menus useful but clunky. I recommend the following if you are going to do serious SAS programming. Buy them used on Amazon or whatever. I would get an older edition, and it will cost less than $10 each. Really.

The Little SAS Book: A Primer, Fifth Edition (or an earlier one)

Nov 7, 2012

by Lora Delwiche and Susan Slaughter

Beginners introduction to SAS. Probably the best single book to buy when learning SAS.
 

Professional SAS Programmer's Pocket Reference Paperback

By Rick Aster

http://www.amazon.com/Professional-SAS-Programmers-Pocket-Reference/dp/189195718X

Wonderful, concise summary of all of the main SAS commands, although you will have to already know SAS to find it useful. I use it to look up specific functions, macro commands, and optoins on various procs because it is faster than using the help menus. But I am old style...

Professional SAS Programming Shortcuts: Over 1,000 ways to improve your SAS programs Paperback

By Rick Aster

http://www.amazon.com/Professional-SAS-Programming-Shortcuts-programs/dp/1891957198/ref=sr_1_1?s=books&ie=UTF8&qid=1417616508&sr=1-1&keywords=professional+sas+programming+shortcuts

I don't use this as much as the above, but if I had time, and were learning SAS instead of trying to rediscover things I already know, I would read through this carefully.

Get in the habit of deleting most intermediate permanent files

Delete files if either

1. You won't need them again or

2. You can easily recreate them again.  *this latter point is usually true;

Beginner programmers tend to save too many intermediate files. Usually it is easier to rerun the entire program instead of saving the intermediate files. Give your final file of interest a name like MASTER or FULL_DATA then keep modifying it by adding variables instead of names like SORTED, STANDARDIZED,RESIDUAL,FITTED.

Consider a macro that helps make it easy to delete files.

%macro delete(library=work, data=temp, nolist=);

proc datasets library=&library &nolist;
delete &data;
run;
%mend;

*sample macro calls

%delete (data=temp);   *for temporary, work files you can also list multiple files names but these disappear anyway at the end of your run;

%delete (library =out, data = one two three) ; *for two node files in directory in;

%delete (library=out, data =one, nolist=nolist);   *Gets rid of list in output;


Ellis SAS tips for New SAS programmers

There is also a posting on Ellis SAS tips for Experienced SAS programmers

It focuses on issues when using large datasets.


Randy’s SAS hints for New SAS programmers, updated Feb 21, 2015

  1. ALWAYS

    begin and intermix your programs with internal documentation. (Note how I combined six forms of emphasis in ALWAYS: color, larger font, caps, bold, italics, underline.) Normally I recommend only one, but documenting your programs is really important. (Using only one form of emphasis is also important, just not really important.)

A simple example to start your program in SAS is

******************
* Program = test1, Randy Ellis, first version: March 8, 2013 – test program on sas features
***************;

Any comment starting with an asterisk and ending in a semicolon is ignored;


    1. Most common errors/causes of wasted time while programming in SAS.

a. Forgetting semicolons at the end of a line

b. Omitting a RUN statement, and then waiting for the program to run.

c. Unbalanced single or double quotes.

d. Unintentionally commenting out more code than you intend to.

e. Foolishly running a long program on a large dataset that has not first been tested on a tiny one.

f. Trying to print out a large dataset which will overflow memory or hard drive space.

g. Creating an infinite loop in a datastep; Here is one silly one. Usually they can be much harder to identify.

data infinite_loop;
x=1;
nevertrue=0;
do while x=1;
if nevertrue =1 then x=0;
end;
run;

h. There are many other common errors and causes of wasted time. I am sure you will find your own


  1. With big datasets, 99 % of the time it pays to use the following system OPTIONS:


options compress =yes nocenter;

or

options compress =binary nocenter;

binary compression works particularly well with many binary dummy variables and sometimes is spectacular in saving 95%+ on storage space and hence speed.


/* mostly use */
options nocenter /* SAS sometimes spends many seconds figuring out how to center large print outs of
data or results. */
ps=9999               /* avoid unneeded headers and page breaks that split up long tables in output */
ls=200;                /* some procs like PROC MEANS give less output if a narrow line size is used */
 

*other key options to consider;

Options obs = max   /* or obs=100, Max= no limit on maximum number of obs processed */
Nodate nonumber /* useful if you don’t want SAS to embed headers at top of each page in listing */
Macrogen     /* show the SAS code generated after running the Macros. */
Mprint   /* show how macro code and macro variables resolve */
nosource /* suppress source code from long log */
nonotes   /* be careful, but can be used to suppress notes from log for long macro loops */

;                       *remember to always end with a semicolon!;


  1. Use these three key procedures regularly

Proc contents data=test; run; /* shows a summary of the file similar to Stata’s DESCRIBE */
Proc means data = test (obs=100000); run; /* set a max obs if you don’t want this to take too long */
Proc print data = test (obs=10); run;


I recommend you create and use regularly a macro that does all three easily:

%macro cmp(data=test);
Proc Contents data=&data; Proc means data = &data (obs=1000); Proc print data = &data (obs=10); run;
%end;

Then do all three (contents, means, print ten obs) with just

%cmp(data = mydata);


  1. Understand temporary versus permanent files;

Data one;   creates a work.one temporary dataset that disappears when SAS terminates;

Data out.one; creates a permanent dataset in the out directory that remains even if SAS terminates;


Define libraries (or directories):

Libname out “c:/data/marketscan/output”;
Libname in “c:/data/marketscan/MSdata”;


Output or data can be written into external files:

Filename textdata “c:/data/marketscan/textdata.txt”;


  1. Run tests on small samples to develop programs and then Toogle between tiny and large samples when debugged.

A simple way is

Options obs =10;
*options obs = max; *only use this when you are sure your programs run.
 

OR, some procedures and data steps using End= dataset option do not work well on partial samples. For those I often toggle between two different input libraries. Create a subset image of all of your data in a separate directory and then toggle using the libname commands;


*Libname in ‘c:/data/projectdata/fulldata’;
Libname in ‘c:/data/projectdata/testsample’;


Time spent creating a test data set is time well spent.

You could even write a macro to make it easy. (I leave it as an exercise!)


  1. Use arrays abundantly. You can use different array names to reference the same set of variables. This is very convenient;


%let rhs=x1 x2 y1 y2 count more;
Data _null_;
Array X {100} X001-X100; *usual form;
Array y {100} ;                     * creates y1-y100;
Array xmat {10,10} X001-X100; *matrix notation allows two dimensional indexes;
Array XandY {*} X001-X100 y1-y100 index ; *useful when you don’t know the count of variables in advance;
Array allvar &rhs. ;     *implicit arrays can use implicit indexes;
 

*see various ways of initializing the array elements to zero;

Do i = 1 to 100; x{i} = 0; end;
 

Do i = 1 to dim(XandY); XandY{i} = 0; end;


Do over allvar; allvar = 0; end;   *sometimes this is very convenient;


Do i=1 to 100 while (y(i) = . );
y{i} = 0;   *do while and do until are sometimes useful;
end;


run;

  1. For some purposes naming variables in arrays using leading zeros improves sort order of variables

Use:
Array x {100} X001-X100;
not
Array x {100} X1-X100;

With the second, the alphabetically sorted variables are x1,x10,x100, x11, x12,..,x19, x2,x20 , etc.


  1. Learn Set versus Merge command (Update is for rare, specialized use)


Data three;   *information on the same person combined into a single record;
Merge ONE TWO;
BY IDNO;
Run;


  1. Learn key dataset options like

Obs=
Keep=
Drop=
In=
Firstobs=
Rename=(oldname=newname)
End=


  1. Keep files being sorted “skinny” by using drop or keep statements

Proc sort data = IN.BIG(keep=IDNO STATE COUNTY FROMDATE) out=out.bigsorted;
BY STATE COUNTY IDNO FROMDATE;
Run;

Also consider NODUP and NODUPKEY options to sort while dropping duplicate records, on all or on BY variables, respectively.


  1. Take advantage of BY group processing

Use FIRST.var and LAST.var abundantly.


USE special variables
_N_ = current observation counter
_ALL_ set of all variables such as Put _all_. Or when used with PROC CONTENTS, set of all datasets.


Also valuable is

PROC CONTENTS data = in._all_; run;


  1. Use lots of comments


* this is a standard SAS comment that ends with a semicolon;


/*   a PL1 style comment can comment out multiple lines including ordinary SAS comments;

* Like this; */


%macro junk; Macros can even comment out other macros or other pl1 style comments;

/*such as this; */ * O Boy!; %macro ignoreme;   mend; *very powerful;


%mend; * end macro junk;


  1. Use meaningful file names!

Data ONE TWO THREE can be useful.


  1. Put internal documentation about what the program does, who did it and when.
  2. Learn basic macro language; See SAS program demo for examples. Know the difference between executable and declarative statements used in DATA step


17. EXECUTABLE COMMANDS USED IN DATA STEP (Actually DO something, once for every record)


Y=y+x (assignment. In STATA you would use GEN y=x or REPLACE Y=X)
 
Do I = 1 to 10;
End; (always paired with DO, can be nested nearly unlimited deepness)


INFile in ‘c:/data/MSDATA/claimsdata.txt’;               define where input statements read from;
File out ‘c:/data/MSDATA/mergeddata.txt’;             define where put statements write to;


Goto johnny;      * always avoid. Use do groups instead;


IF a=b THEN y=0 ;
ELSE y=x; * be careful when multiple if statements;
CALL subroutine(); (Subroutines are OK, Macros are better)


INPUT   X ; (read in one line of X as text data from INFILE)
PUT   x y= / z date.; (Write out results to current LOG or FILE file)


MERGE IN.A IN.B ;
BY IDNO;         *   Match up with BY variable IDNO as you simultaneously read in A&B;

Both files must already be sorted by IDNO.

SET A B;                                           * read in order, first all of A, and then all of B;

UPDATE   A B; *replace variables with new values from B only if non missing in B;


OUTPUT out.A;      *Write out one obs to out.A SAS dataset;
OUTPUT;                *Writes out one obs of every output file being created;

DELETE;   * do not output this record, and return to the top of the datastep;

STOP;                               * ends the current SAS datastep;


18. Assignment commands for DATA Step are

only done once at the start of the data step


DATA ONE TWO IN.THREE;

*This would create three data sets, named ONE TWO and IN.THREE

Only the third one will be kept once SAS terminates.;

Array x {10} x01-x10;
ATTRIB x length =16 Abc length=$8;
RETAIN COUNT 0;
BY state county IDNO;
Also consider  
BY DESCENDING IDNO; or BY IDNO UNSORTED; if grouped but not sorted by IDNO;
DROP i;   * do not keep i in final data set, although it can still be used while the data step is running
KEEP IDNO AGE SEX; *this will drop all variables from output file except these three;
FORMAT x date.;   *permanently link the format DATE. To the variable link;

INFORMAT ABC $4.;

LABEL AGE2010 = “Age on December 31 2010”;
LENGTH x 8; *must be assigned the first time you reference the variable;
RENAME AGE = AGE2010; After this point you must use the newname (AGE2010);
OPTIONS NOBS=100; One of many options. Note done only once.


19. Key Systems language commands

LIBNAME to define libraries
FILENAME to define specific files, such as for text data to input or output text

TITLE THIS TITLE WILL APPEAR ON ALL OUTPUT IN LISTING until a new title line is given;

%INCLUDE

%LET year=2011;

%LET ABC = “Randy Ellis”;


20. Major procs you will want to master

DATA step !!!!! Counts as a procedure;

PROC CONTENTS

PROC PRINT

PROC MEANS

PROC SORT

PROC FREQ                      frequencies

PROC SUMMARY      (Can be done using MEANS, but easier)

PROC CORR (Can be done using Means or Summary)

PROC REG       OLS or GLS

PROC GLM   General Linear Models with automatically created fixed effects

PROC FORMAT /INFORMAT

PROC UNIVARIATE

PROC GENMOD nonlinear models

PROG SURVEYREG clustered errors

None of the above will execute unless a new PROC is started OR you include a RUN; statement.

21. Formats are very powerful. Here is an example from the MarketScan data. One use is to simply recode variables so that richer labels are possible.


Another use is to look up or merge on other information in large files.


Proc format;
value $region
1=’1-Northeast Region           ‘
2=’2-North Central Region       ‘
3=’3-South Region               ‘
4=’4-West Region               ‘
5=’5-Unknown Region             ‘
;


value $sex

1=‘1-Male           ‘
2=‘2-Female         ‘
other=‘ Missing/Unknown’

;


*Three different uses of formats;

Data one ;
sex=’1’;
region=1;
Label sex = ‘patient sex =1 if male’;
label region = census region;
run;

Proc print data = one;

Run;


data two;
set one;
Format sex $sex.; * permanently assigns sex format to this variable and stores format with the dataset;
Run;

Proc print data = two;
Run;

Proc contents data = two;
Run;

*be careful if the format is very long!;


Data three;
Set one;
Charsex=put(sex,$sex.);
Run;

*maps sex into the label, and saves a new variable as the text strings. Be careful can be very long;

Proc print data =three;
Run;


Proc print data = one;
Format sex $sex.;
*this is almost always the best way to use formats: Only on your results of procs, not saved as part of the datasets;
Run;


If you are trying to learn SAS on your own, then I recommend you buy:

The Little SAS Book: A Primer, Fifth Edition (or an earlier one)

Nov 7, 2012

by Lora Delwiche and Susan Slaughter

Beginners introduction to SAS. Probably the best single book to buy when learning SAS.

Deflategate pressure drop is consistent with a ball air temperature of 72 degrees when tested initially.

Deflategate pressure drop is consistent with a ball air temperature of 72 degrees when tested initially.

I revised my original Deflategate posting after learning that it is absolute air pressure not pressure above standard sea level pressure that follows the Ideal Gas Law.  I also allowed for stretching of the leather once the ball becomes wet. And for the possibility that the cold rain was was colder (45 degrees F) below the recorded air temperature at 53 degrees F.  Together these adjustments make it even easier for the weather to fully explain the drop in ball pressure.

My Bottom Line: The NFL owes the Patriot Nation and Bob Kraft a big apology.

Correction #1: My initial use of the ideal gas formula did not recognize that it is absolute pressure, not pressure above the ambient air pressure that matters. Hence a ball with a pressure of 12.5 PSI is actually 12.5 PSI above the surrounding air pressure, which is about 14 PSI at sea level. So a decline from 12.5 PSI to 10.5 PSI is actually only an 8.2 percent decline in absolute pressure from 26.5 to 24.5 PSI. This makes it much easier for temperature changes to explain the difference in ball pressure. Only an 8.2 percent change in absolute temperature (approximately a 42 degree Fahrenheit drop) would be required it that were the only change needed.

Correction #2: It is well established that water allows leather to stretch. I found one site that noted that water can allow leather to stretch by 2-5% when wet.  It does not specify how much force is needed to achieve this.

https://answers.yahoo.com/question/index;_ylt=A0LEVvwgfs9UP0AAr40nnIlQ?qid=20060908234923AAxt7xP

It is plausible that a new ball made of leather under pressure (scuffed up to let in the moisture quickly)  might stretch 1 percent upon getting wet (such as in the rain). Since volume goes up with the cube of this stretching, this would be a (1.01)^3 -1= 3 percent increase in ball volume or decline in pressure. This amount would reduces the absolute temperature difference needed for the 2 PSI drop to only 5.2 percent (a change of only 27 degrees F.)

Correction #3: It was raining on game day, and the rain was probably much colder than the outside air temperature. So it is plausible that the game ball was as cold as 45 degrees Fahrenheit at game time when the low ball pressures were detected. This makes even lower initial testing temperatures consistent with the professed levels of underinflation.

A single formula can be used to calculate the ball temperature needed when tested initially to explain a ball pressure detected during the game that is 2 PSI lower, after getting colder (to 45 degrees F), .004 smaller (since ball volume shrinks when cold), and stretched 1% due to rain. It would be

Pregame testing temperature in F =(pressure change as a ratio)/(volume change due to cold)/(volume change due to leather stretching 1% when wet)*(45 degree ball temperature during game+460 degrees) - 460 degrees

(12.5+14)/(10.5+14)/(.996)/(1.01^3)(45+460) - 460 = 72 degrees Fahrenheit

Given this math, it would have been surprising if the ball pressure had NOT declined significantly.

Final comment #1: All of these calculations and hypotheses can be tested empirically. See the empirical analysis done by Headsmart Labs (http://www.headsmartlabs.com). They find that a rain plus a 25 degree drop is consistent with a 1.82 PSI decrease.

Final comment #2: Since the original game balls were reinflated by officials during halftime, the true ball pressures during the first half will never be known. Moreover there seems to be no documentary record of their pressures at the time they were re-inflated.

The XLIX Superbowl was a terrific game from the point of view of Patriots fans. Now it is time for the NFL  to own up to its own mistake in accusing the Patriots of cheating.  It was just a matter of physics.

Revised calculations


Various combinations of testing temperatures and PSI
A B C D E F G H I J K L M N O
Adjustments for temperature only, correcting for absolute pressure at 14 PSI at sea level Adjustments for changes in ball volume Adjusting for temperature and football volume
Temperature F Degrees above Absolute zero Temperature adjustment Various game time or testing PSI readings surface area sphere radius mean football radius volume Volume adjustment Various game time or testing PSI readings
Game time temperature 45 505 1.000 10.5 11 11.5 189 3.8782 3.81183 232 1.000 10.5 11 11.5
60 520 1.030 11.2 11.7 12.3 189.2427 3.8807 3.81427 232.447 0.998 11.3 11.8 12.3
70 530 1.050 11.7 12.2 12.8 189.4045 3.8824 3.81590 232.7451 0.997 11.8 12.3 12.8
Possibl e testing temperatures 80 540 1.069 12.2 12.7 13.3 189.5663 3.8840 3.81753 233.0434 0.996 12.3 12.9 13.4
90 550 1.089 12.7 13.2 13.8 189.7280 3.8857 3.81916 233.3418 0.994 12.8 13.4 13.9
100 560 1.109 13.2 13.7 14.3 189.8898 3.8873 3.82079 233.6403 0.993 13.4 13.9 14.5
110 570 1.129 13.7 14.2 14.8 190.0516 3.8890 3.82242 233.939 0.992 13.9 14.5 15.0
120 580 1.149 14.1 14.7 15.3 190.2134 3.8906 3.82404 234.2378 0.990 14.4 15.0 15.6
130 590 1.168 14.6 15.2 15.8 190.3752 3.8923 3.82567 234.5367 0.989 14.9 15.5 16.1
140 600 1.188 15.1 15.7 16.3 190.5370 3.8940 3.82730 234.8357 0.988 15.5 16.1 16.7
150 610 1.208 15.6 16.2 16.8 190.6988 3.8956 3.82892 235.1349 0.987 16.0 16.6 17.2
160 620 1.228 16.1 16.7 17.3 190.8606 3.8973 3.83054 235.4342 0.985 16.5 17.1 17.8
Temperature (Fo) at which ball would pass test. 2 PSI diff 1.5 PSI diff 1 PSI diff 88 77 67
Temperature only 86 75 65
Temperature and volume change from temp 88 77 67
temp, volume, and stretching from wetness 72 62 51
Last row calculated as (12.5+14)/(inferred test level+14)/(0.996)/(1.01^3)*(45+460)-460
Notes
Revised calculations allow for sea level temperature to be 14 PSI, so a change from 10.5 to 12.5 PSI (above this level requires only a (12.5+14)/(10.5+14)-1=8.2 percent change in absolute temperature.
See notes at the top, but final calculations also allow for the possiblities that ball temperature was 45 degrees, not 53 due to cold rain, and 1% stretching in leather due to rain.
Fields in first row and first column are input parameters, others are calculated


Original post

There is no mention of the temperature at which the footballs need to be stored or tested in the official NFL rule book. (Sloppy rules!)

The process of scuffing up the new balls to make them feel better no doubt warms them up. It would be impossible for it to be otherwise. An empirical question is how much did it warm them up and what temperature were they when tested?

Surface temps could have been below their internal temperature of the air, which is what matters for the pressure. Leather is a pretty good insulator (hence its use in many coats).

Anyone who took high school physics may remember that pressure and temperature satisfy

PV=nRT

Pressure*Volume=Number of moles*ideal gas constant*Temperature  (Ideal Gas Law)

Temperature needs to be measured in degrees above absolute zero, which is -459.67 Fahrenheit (sorry metric readers!). The temperature at game time was 53 degrees. So the right question to ask is:At what temperature,  T1, would the air in the ball have to be at the time the balls were tested such that once they cooled down to T0=53 degrees they measures two pounds per square inch (PSI) below the allowed minimum?

The lowest allowed temperature for testing was 12.5 PSI. We are told only vaguely that the balls were 2 PSI lower than this, but this is not a precise number. It could be it was rounded from 1.501 PSI. that would mean they  might have been 11 pounds PSI when tested during the game.  I examine 10.5, 11 and 11.5 as possible game time test PSI levels.The following tables shows possible combinations of game time testing temperature and half-time testing temperatures that would be consistent with various pressures.The right hand side of the table makes an adjustment for the fact that the leather/rubber in the ball would also have shrunk as the ball cooled down, which works against the temperature.Using the formulaPSI1=PSI0*((T1+459.67)/(T0+459.67). (See correction above!) Ignoring the volume change of the ball, it is straightforward to solve for what initial temperature the balls would have had to be for the observed game time temperatures.

Adjusting for a plausible guess at the small amount that the leather plus rubber bladder would have also changed makes only a small difference.

For a 1.5 PSI difference from testing to halftime , the air inside of them would have had to be at about 128 degrees at the time they were tested. (The leather skin could have been a lower temperature.) This would have made them feel warm but not burning hot to the hand.

Allowing the balls to be warm when tested is sneaky or perhaps accidental, but not cheating.

Go Pats!

Various combinations of testing temperatures and PSI
A B C D E F G H I J K L M N O
Adjustments for temperature only Adjustments for changes in ball volume Adjusting for temperature and football volume
Temperature F Degrees above Absolute zero Temperature adjustment Various game time or testing PSI readings surface area sphere radius mean football radius volume Volume adjustment Various game time or testing PSI readings
Game time temperature 53 512.67 1.000 10.5 11 11.5 189 3.8782 3.81183 232 1.000 10.5 11 11.5
Possibl e testing temperatures 80 539.67 1.053 11.1 11.6 12.1 189.4368 3.8827 3.81623 232.8048 1.003 11.0 11.5 12.1
90 549.67 1.072 11.3 11.8 12.3 189.5986 3.8844 3.81786 233.1031 1.005 11.2 11.7 12.3
100 559.67 1.092 11.5 12.0 12.6 189.7604 3.8860 3.81949 233.4015 1.006 11.4 11.9 12.5
110 569.67 1.111 11.7 12.2 12.8 189.9222 3.8877 3.82112 233.7001 1.007 11.6 12.1 12.7
120 579.67 1.131 11.9 12.4 13.0 190.0840 3.8893 3.82274 233.9988 1.009 11.8 12.3 12.9
130 589.67 1.150 12.1 12.7 13.2 190.2458 3.8910 3.82437 234.2976 1.010 12.0 12.5 13.1
140 599.67 1.170 12.3 12.9 13.5 190.4076 3.8926 3.82600 234.5965 1.011 12.1 12.7 13.3
150 609.67 1.189 12.5 13.1 13.7 190.5693 3.8943 3.82762 234.8956 1.012 12.3 12.9 13.5
160 619.67 1.209 12.7 13.3 13.9 190.7311 3.8959 3.82924 235.1948 1.014 12.5 13.1 13.7
Temperature (Fo) at which ball would pass test. 151 123 98 159 128 101
Notes
Fields in yellow are input parameters, others are calculated
Column C is temperature minus absolute zero
Column D is the ratio of column C to the game time temp in absolute degrees and shows how much higher PSI would have been than at game time.
Columns E through G show possible testing PSI for three possible game time PSI levels.
Columns H through L show adjustments to volume which tend to reduce the PSI as a ball is heated. Calculations use rate of expansion of hard rubber per square inch per degree.
Columns M through O show Balll PSI after adjusting for both air temperature and football volume
Parameters and formulas
absolute zero= -459.67 fahrenheit
hard rubber expansion 42.8 (10-6 in/(in oF))*) http://www.engineeringtoolbox.com/linear-expansion-coefficients-d_95.html
or 0.0000428 Used for column I expansion of surface area
Surface area assume to grow with the square of this proportion with temperature.
The approximate volume and surface area of a standard football are 232 cubic inches and 189 square inches, respectively.
http://www.answers.com/Q/Volume_and_surface_area_of_a_football
Surface of a sphere formula
4pr2 Used to calculate radius of sphere
volume of sphere formula
4/3*pi*radius3 Used to calculate volume of football. Volume adjusted downward by a fixed proportion because footballs are not spheres.


NFL rules

Rule 2 The BallSection 1BALL DIMENSIONSThe Ball must be a “Wilson,” hand selected, bearingthe signature of the Commissioner of the League, Roger Goodell.The ball shall be made up of an inflated (12 1/2 to 13 1/2 pounds) urethane bladder enclosed in a pebble grained, leather case(natural tan color) without corrugations of any kind. It shall have the form of a prolate spheroid and the size and weightshall be: long axis, 11 to 11 1/4 inches; long circumference, 28 to 28 1/2 inches; short circumference, 21 to 21 1/4 inches;weight, 14 to 15 ounces.The Referee shall be the sole judge as to whether all balls offered for play comply with these specifications. A pump is to befurnished by the home club, and the balls shall remain under the supervision of the Referee until they are delivered to theball attendant just prior to the start of the game.

From the Free Dictionaryideal gas lawn.A physical law describing the relationship of the measurable properties of an ideal gas, where P (pressure) × V (volume) = n (number of moles) × R (the gas constant) × T (temperature in Kelvin). It is derived from a combination of the gas laws of Boyle, Charles, and Avogadro. Also called universal gas law.


#6 Raise the minimum wage for jobs not offering health insurance

Time to change the policy discussion.

Congress has been unwilling to raise the minimum wage despite strong public support for doing so. This blog suggests a concrete approach for getting even broader public support and potentially reducing the need for federal taxes.

As of January 1, 2015 29 states and DC have minimum wages above the Federal minimum wage, which is still only $7.25 per hour. For a worker working 40 hours per week 50 weeks per year, the minimum wage yields only $14,500 per year, which is below the federal poverty level ($15,730) for a  family of two in 2014 in all states and DC. At these low income levels, even full time employees still cannot afford health insurance and will mostly be relying on large subsidies for health insurance  and the employee earned tax credit (EIT).  The insurance subsidy for a minimum wage worker enrolling in a private silver plan is currently at least $4,237 per year for an adult with one child, while the EIT is currently $3,359 for a single worker with one child if earning the minimum wage. Hence an employer paying only the minimum wage is counting on a subsidy from the government of at least $7596 per year for a worker with one child, which is $3.80 per hour.

A simple approach that will encourage more firms to offer health insurance is to raise the minimum wage required for any position that does not include any offer of subsidized health insurance. For concreteness I propose a minimum wage of $12 per hour without health insurance, versus $8 per hour with a job that includes subsidies for health insurance. (Those age 21 and under would also be eligible for the $8 per hour rate.) Whether the job is for 10, 30 or 40 hours per week does not matter, only whether there is subsidized health insurance. This four dollar per hour increment will encourage firms to bear the full cost of their workers, and reduce the burden on federal tax revenue and the budget.

In Massachusetts, the minimum wage just increased on January 1, 2015 from $8 to $9 per hour. The State's economy continues to do well, and I still see signs in retail windows showing help is still wanted. Plus we still have lots of low-cost food and retail stores and services. Reduced employment is not visible, and would likely be more than offset by the stimulatory effects of reduced taxes. I see no reason why we couldn't leave it up to states to decide whether they want to use the same or higher minimum wages for jobs with or without health insurance as long as the two minimums are reached.

In Australia, the minimum wage is US$ 13.84 (16.87 Australian dollars), everyone has national health insurance, and the unemployment rate is comparable to the US at 6.2 percent (November, 2014). We rather liked it when we were there in 2011 that our gardener and most restaurant workers were Australian citizens, who spoke English well, not low-paid foreigners and recent immigrants, as they are in the US.

As I write this blog, the US congress is debating whether to partially undo the employer mandate provisions of the Affordable Care Act by allowing firms to not have to pay any penalty for not offering health insurance for employees working less than 40 hours per week. The current standard is 30 hours per week. This would have a potentially disastrous effect since so many workers work about 40 hours and it would be easy for employers  to avoid the (modest) ACA penalties by reducing worker hours. Plus, without the employer mandate, many workers will remain uninsured. Having a higher minimum wage for jobs not offered health insurance will greatly weaken the incentive for firms to drop employee hours to avoid offering insurance coverage and eliminate the 40 versus 30 hours as an issue. In fact it would encourage firms to offer full- rather than part-time jobs with health insurance, reducing the need for public subsidies.

This minimum wage policy particularly makes sense if it is combined with the proposal in my next (future) blog #7 to eliminate all family health insurance policies, insure individuals not households, and have all children under age 21 be covered independently of their parent's insurance policy. Making all children eligible for the exchange coverage options regardless of their (parent's) income would be one possible approach.

Here are links to my four previous blogs from 2013 on Taxes and fiscal policies. Still the right direction.

#1 All Taxes and Budgets Should be Expressed as Dollars per Person

#2. Include Social Security and Medicare taxes when discussing tax burdens

#3 Tax Bads (or at least don’t subsidize them!)

#4 State Tax Rates are Not Related to State Income or Growth

#5 “Let the Children and Grandchildren Pay?”


Useful Data Links to US Government data

Websites for Federal Administrative Data sets:

US Administration for International Development:
Foreign aid from the U.S: Data and Tools

Department of Agriculture:
Economic Research Services: Supplemental Nutrition Assistance Program (SNAP) Data System
Food and Nutrition Services: Commodity Supplemental Food Program Data
Food Safety Inspection Services: Recalls and Quarterly Enforcement Reports
Forest Inventory Data
National Agricultural Statistics Service: Cropland Data
Natural Resource Conservation Service: Conservation Financial Assistance Programs' Enrollment Data
Risk Management Agency (RMA): Program Costs and Outlays Data
RMA: Actuarial Data
Web Based Supply Chain Management Reports Data

US Army:
Army Corps of Engineers: U.S. Waterborne Commerce Data

Department of Commerce:
Bureau of Economic Analysis (BEA): Foreign Direct Investments Data in the US
BEA: US National Income and Product Account (NIPA) Data
Economic Development Administration: Program Data
Census: Business Register Data and Longitudinal Business Database
Census: Longitudinal Employer-Household Dynamics
Census: County and Zip Code Business Patterns
International Trade Administration (ITA): U.S. Exporting Companies Data
ITA: Export-Supported Employment Data
ITA: Visitors Arrivals Program (Form I-94) Data
ITA: International Air Travel Statistics ( Form I-92) Program Data
National Climate Data Center: National climate and historic weather data
National Marine Fisheries Service: Recreational Fisheries statistics or Commercial Fisheries Statistics

Commodities Futures Trading Commission:
Filings, transactions, and other data
Market Report Data

Consumer Financial Protection Bureau:
Credit Card Agreement Database
Consumer Complaint Database

Consumer Product Safety Commission:
Injury Statistics

Department of Education:
Civil Rights Data for Public Schools
EDFacts Data for K-12 Educational Programs
National Center for Education Statistics: Common Core of Data on Public School
Federal Student Aid Data
National Reporting System Data for Adult Education
Nation’s Report Card System Data

Department of Energy:
Energy Information Administration (EIA): Energy Prices Data
EIA: Renewable Energy Market Data
EIA: Crude Oil Production and Stocks Data

Environmental Protection Agency:
Air Quality Data
Enforcement Dockets data
National Pollutant Discharge Elimination System (NPDES) permits and compliance data
Toxic Substances Control Act Chemical Substance Inventory
Superfund Sites (CERCLIS database)

Equal Employment Opportunity Commission
Enforcement and Litigation Statistics on Employment Discrimination

Federal Court System:
Bankruptcy Statistics

Federal Deposit Insurance Corporation:
Industry Data
Failed Bank Data

Federal Emergency Management Agency:
Assistance Record Data

Federal Financial Institutions Examination Council:
Financial and Structural Data for FDIC-insured Institution
Home mortgage loans data
Reinvestment Act Data

The Federal Reserve:
Consumer Credit data
Finance Companies Data
Foreign exchange rates
Government Receipts for Expenditures and Investments
Money Stock Measures
Treasury Account Series data

Federal Trade Commission:
Fraud and Identity Theft aggregates (Consumer Sentinel Network)

Fish and Wildlife Services:
Wetlands Data

General Services Administration:
Federal Procurement Report Data
FFATA Sub-award Reporting System (Data Reporting)
Small Business Goaling Report

Department of Health and Human Services:
Agency for Substances and Disease Registry (ASTDR): Environmental Health Webmap Data
ASTDR: Hazardous Substances Emergency Events Surveillance Report Data
ASTDR: National Toxic Substance Incidents Program Data
Center for Disease Control and Prevention (CDC): Community Water Fluoridation Statistics 
CDC: National Program of Cancer Registries Data
CDC: Surveillance Data
Center for Medicare and Medicaid Services (CMS): Medicare Claims Data or Microdata
CMS: National Health Expenditures Data
CMS: Provider of Service Data
National Directory of New Hires Data
National Center for Health Statistics: Vital Statistics: Births, Deaths, Marriages, Divorces
Temporary Assistance to Needy Families Administrative Records

Department of Homeland Security:
Immigration Statistics

Department of Housing and Urban Development:
Community Development Block Grants Expenditures Data
Family Data on Public and Indian Housing and Microdata
Fair Market Rents Data
Government Sponsored Enterprise Data
Metropolitan Area Quarterly Residential and Business Vacancy Report Data
National Low Income Housing Tax Credit Database
Neighborhood Stabilization Program Data
Program Income Limits Data

Department of Interior:
US Geological Survey (USGS): Biodiversity, Species data
USGS: Land Cover and Land Use data
USGS: Water Resources data
USGS: Water Quality Data

International Trade Commission:
Tariffs Databases

Department of Justice:
Bureau of Prison: Inmate, Population, and Staff Statistics
Bureau of Justice Statistics(BJS): Court Statistics Project Data
BJS: Federal Justice Statistics Program Data
BJS: Law Enforcement Management and Administrative Statistics
BJS: National Corrections Reporting Program Data
BJS: National Incident-Based Reporting System Data
BJS: National Prisoner Statistics Program Data
Federal Bureau of Investigation: Uniform Crime Reports Data

Department of Labor:
Bureau of Labor Statistics: Quarterly Census of Employment and Wages
Foreign Labor Certification Office: H-1B Data
Labor Retirement and Welfare Benefit Plan Data Set
(Form 5500)
Occupational Safety and Health Administration (OSHA): Work-Related Injury or Illness Data
OSHA: Enforcement Data (Inspection Data)
OSHA: Worker Fatalities/Catastrophes Report (FAT/CAT) 

National Aeronautics and Space Administration:
Urban Landsat

Patent and Trademark Office:
U.S. Patent and Trademark Office patent data

Department of Transportation:
Bureau of Transportation (BTS): Air Carrier Statistics
BTS: Intermodal Passenger Connectivity Database
Maritime Administration: Maritime Travel and Transportation Statistics

Department of Treasury:
Bureau of Fiscal Service: Public Debt Report
Financial Crime Enforcement Network: Mortgage and Real Estate Fraud Data Set
Interest Rate Statistics
Internal Revenue Service (IRS): Corporate Tax Statistics (Form 1120)
IRS: Employee Benefit Plans (Form 5500)
IRS: Individual Tax Statistics (Form 1040)
IRS: Quarterly Payroll Taxes (Form 941)

Securities and Exchange Commission:
Filings
Mutual Fund Fees and Expenses
Program and Market Data
Short Sale Volume Data 

Small Business Administration:
Small Business Lender and Loan Data
Social Security Administration:
Social Security Programs Data
Earnings and Employment Data for Workers Covered under Social Security and Medicare

Department of Veteran's Affairs:
Veterans Benefits Administration Reports
National Pollutant Discharge Elimination System (NPDES) permits and compliance data

Websites for Agency Procedures on Access to Restricted-Use Administrative Data Sets:

Bureau of Labor Statistics Confidential Data Sets Access
Census Bureau Restricted Restricted Data Sets Access
Agency for Healthcare Research and Quality Restricted Use Data Access
National Center for Health Statistics Restricted Use Data Access
National Center for Education Statistics Restricted Use Data Licenses
Bureau of Transportation Statistics Restricted-Release Airline Data Access
USDA's Economic Research Service Agriculture Resource Management Survey Data Access
National Institute on Aging Restricted Data Access
Center for Medicare and Medicaid Limited Data Access
Social Security Administration Health and Retirement Study Data Access
National Science Foundation/National Center for Science and Engineering Statistics Restricted-Use Data Access
Substance Abuse and Mental Health Data Archive

Important Reposting on Placebo surgery from TIE

I am forwarding this excellent TIE post since every health researcher and indeed every consumer should realize how serious the lack of evidence is on many common surgical procedures. Here are some quotes organized in a succinct way.

"2002... arthroscopic surgery for osteoarthritis of the knee ... Those who had the actual procedures did no better than those who had the sham surgery. " (We still spend $3 billion a year on this procedure)
"2005... percutaneous laser myocardial revascularization, ...  didn’t improve angina better than a placebo"
"2003, 2009, 2009... vertebroplasty — treating back pain by injecting bone cement into fractured vertebrae ... worked no better than faking the procedure."
"2013 ... arthroscopic procedures for tears of the meniscus cartilage in the knee... performed no better than sham surgery" (We do about 700,000 of them with direct costs of about $4 billion.)
"[2014] ... systematic review of migraine prophylaxis [prevention], while 22 percent of patients had a positive response to placebo medications and 38 percent had a positive response to placebo acupuncture, 58 percent had a positive response to placebo surgery.
"2014... 53 randomized controlled trials that included placebo surgery as one option. In more than half of them ... the effect of sham surgery was equivalent to that of the actual procedure."

If you are getting surgery done, do your own research on it and ask questions!


-------- Original Message --------

Subject: “The Placebo Effect Doesn’t Apply Just to Pills” plus 1 more
Date: Thu, 9 Oct 2014 11:13:06 +0000
From: The Incidental Economist <tie@theincidentaleconomist.com>
To: <ellisrp@bu.edu>

“The Placebo Effect Doesn’t Apply Just to Pills” plus 1 more


The Placebo Effect Doesn’t Apply Just to PillsPosted: 09 Oct 2014 04:00 AM PDT

The following originally appeared on The Upshot (copyright 2014, The New York Times Company).

For a drug to be approved by the Food and Drug Administration, it must prove itself better than a placebo, or fake drug. This is because of the “placebo effect,” in which patients often improve just because they think they are being treated with something. If we can’t compare a new drug with a placebo, we can’t be sure that the benefit seen from it is anything more than wishful thinking.

But when it comes to medical devices and surgery, the requirements aren’t the same. Placebos aren’t required. That is probably a mistake.

At the turn of this century, arthroscopic surgery for osteoarthritis of the knee was common. Basically, surgeons would clean out the knee usingarthroscopic devices. Another common procedure was lavage, in which a needle would inject saline into the knee to irrigate it. The thought was that these procedures would remove fragments of cartilage and calcium phosphate crystals that were causing inflammation. A number of studieshad shown that people who had these procedures improved more than people who did not.

However, a growing number of people were concerned that this was really no more than a placebo effect. And in 2002, a study was published thatproved it.

A total of 180 patients who had osteoarthritis of the knee were randomly assigned (with their consent) to one of three groups. The first had a standard arthroscopic procedure, and the second had lavage. The third, however, had sham surgery. They had an incision, and a procedure was faked so that they didn’t know that they actually had nothing done. Then the incision was closed.

The results were stunning. Those who had the actual procedures did no better than those who had the sham surgery. They all improved the same amount. The results were all in people’s heads.

Many who heard about the results were angry that this study occurred. They thought it was unethical that people received an incision, and most likely a scar, for no benefit. But, of course, the same was actually true for people who had arthroscopy or lavage: They received no benefit either. Moreover, the results did not make the procedure scarce. Years later, more than a half-million Americans still underwent arthroscopic surgery for osteoarthritis of the knee. They or their insurers spent about $3 billion that year on a procedure that was no better than a placebo.

Sham procedures for research aren’t new. As far back as 1959, the medical literature was reporting on small studies that showed that procedures like internal mammary artery ligation, a surgical procedure used to treat angina, were no better than a fake incision.

In 2005, a study was published in the Journal of the American College of Cardiology proving that percutaneous laser myocardial revascularization, in which a laser is threaded through blood vessels to cut tiny channels in the heart muscle, didn’t improve angina better than a placebo either. We continue to work backward and use placebo-controlled research to try to persuade people not to do procedures, rather than use it to prove conclusively that they work in the first place.

A study published in 2003, without a sham placebo control, showed that vertebroplasty — treating back pain by injecting bone cement into fractured vertebrae — worked better than no procedure at all. From 2001 through 2005, the number of Medicare beneficiaries who underwent vertebroplasty each year almost doubled, from 45 to 87 per 100,000. Some of them had the procedure performed more than once because they failed to achieve relief. In 2009, not one but two placebo-controlled studies were published proving that vertebroplasty for osteoporotic vertebral fractures worked no better than faking the procedure.

Over time, after the 2002 study showing that arthroscopic surgery didn’t work for osteoarthritis of the knee, the number of arthroscopic procedures performed for this condition did begin to go down. But at the same time, the number of arthroscopic procedures for tears of the meniscus cartilage in the knee began to go up fast. Soon, about 700,000 of them were being performed each year, with direct costs of about $4 billion. Less than a year ago, many were shocked when arthroscopic surgery for meniscal tearsperformed no better than sham surgery. This procedure was the most common orthopedic procedure performed in the United States.

The ethical issues aren’t easily dismissed. Theoretically, a sugar pill carries no risk, and a sham procedure does. This is especially true if the procedure requires anesthesia. The surgeon must go out of his or her way to fool the patient. Many would have difficulty doing that.

But we continue to ignore the real potential that many of our surgical procedures and medical devices aren’t doing much good — and might even be doing harm, since real surgery has been shown to pose more risks than sham surgery.

Rita Redberg, in a recent New England Journal of Medicine Perspectives article on sham controls in medical device trials, noted that in a recentsystematic review of migraine prophylaxis, while 22 percent of patients had a positive response to placebo medications and 38 percent had a positive response to placebo acupuncture, 58 percent had a positive response to placebo surgery. The placebo effect of procedures is not to be ignored.

Earlier this year, researchers published a systematic review of placebo controls in surgery. They searched the medical literature from its inception all the way through 2013. In all that time, they could find only 53 randomized controlled trials that included placebo surgery as one option. In more than half of them, though, the effect of sham surgery was equivalent to that of the actual procedure. The authors noted, though, that with the exception to the studies on osteoarthritis of the knee and internal mammary artery ligation noted above, “most of the trials did not result in a major change in practice.”

We have known about the dangers of ignoring the need for placebo controls in research on surgical procedures for some time. When the few studies that are performed are published, we ignore the results and their implications. Too often, this is costing us many, many billions of dollars a year, and potentially harming patients, for no apparent gain.

@aaronecarroll

Share

Placebo historyPosted: 09 Oct 2014 03:00 AM PDT

Here are my highlights from “Placebos and placebo effects in medicine: historical overview,” by Anton de Craen and colleagues. All are direct quotes.

  • In 1807 Thomas Jefferson, recording what he called the pious fraud, observed that ‘one of the most successful physicians I have ever known has assured me that he used more bread pills, drops of colored water, and powders of hickory ashes, than of all other medicines put together’. About a hundred years later, Richard Cabot, of Harvard Medical School, described how he ‘was brought up, as I suppose every physician is, to use placebo, bread pills, water subcutaneously, and other devices’.
  • The word placebo (Latin, ‘I shall please’) was first used in the 14th century. In that period, it referred to hired mourners at funerals. These individuals often began their wailings with Placebo Domino in regione vivorum, the ninth verse of psalm cxiv, which in the Latin Vulgate translation means ‘I shall please the Lord in the land of the living’. Here, the word placebo carries the connotation of depreciation and substitution, because professional mourners were often stand-ins for members of the family of the deceased.
  • In 1801, John Haygarth reported the results of what may have been the first placebo-controlled trial. A common remedy for many diseases at that time was to apply metallic rods, known as Perkins tractors, to the body. These rods were supposed to relieve symptoms through the electromagnetic influence of the metal. Haygarth treated five with imitation tractors made of wood and patients found that four gained relief. He used the metal tractors on the same five patients the following day and obtained identical results: four of five subjects reported relief.
  • In the 1785 New Medical Dictionary, placebo is described as ‘a commonplace method or medicine’. In 1811, the revised Quincy’s Lexicon-Medicum as ‘an epithet given to any medicine adapted defines placebo more to please than to benefit the patient’.
  • In the 1930s, several important papers were published with regard to the introduction of placebos in clinical research. [... Two] papers assessed the value of drugs used in the treatment of angina pectoris in cross-over experiments and deceptively administered placebos to the ‘no-treatment’ comparison group. [...] In both trials the drugs were judged to exert no specific action that might be useful in the treatment of angina. Gold and colleagues tried to explain why inert interventions might work: their points included ‘confidence aroused in a treatment’, the ‘encouragement afforded a new and ‘a of medical by procedure’ change advisor’.
  • Placebo was a fraud and deception that had the ‘moral effect of a remedy given specially for the disease’, but placebos did not affect the natural course of disease; they were a priori excluded from having such an impact. Placebos were therapeutic duds to manage patients, or, as in the Flint investigation, a camouflage behind which to watch nature take its course.
  • In 1938, the word placebo was first applied in reference to the treatment given to concurrent controls in a trial.
  • The efficacy of cold vaccines was evaluated in several placebo-controlled trials. [...] The conclusion [of one] reads ‘one of the most significant aspects of this study is the great reduction in the number of colds which the members of the control groups reported during the experimental period. In fact these results were as good as many of those reported in uncontrolled studies which recommended the use of cold vaccines’. The placebo effect was born.

@afrakt

Share

BU well represented at ASSA meetings in 2015

As would be expected since the Allied Social Science Association (ASSA) meetings are in Boston this January, BU is well represented on the ASSA program. After searching and scanning through the program for current and former students and current faculty, I identified 81 BU affiliate names on the program, whether as authors, discussants or presiding. This includes 17 of our regular BU economics faculty. The full list with affiliations is shown below. Note that his reflects not only economics department members, but also SMG, SPH, Political Science, Law or whatever may be the current affiliation.

In 2014, when the meetings were in Philadelphia, there were 70 BU affiliates participating.
This count is almost certainly an undercount, since recognizing the names of BU alumni is imprecise. I apologize for missing some names.

If one restricts the count to only names of current BU affiliates then there are 57 names affiliated with BU, which is ahead of BC (32) and Brown (21) but well behind our neighbors of Harvard (270) and MIT (152). We seem to rank about 15th. We still have a ways to go!

As usual (always?) there will be a BU reception at the meetings. This year it will be Sunday January 4 6-8 p.m. in the Westin Hotel. Look in the program for the exact room.

It is not too early to plan on submiting for the next ASSA meetings:

January 3-5, 2016 (Sunday, Monday & Tuesday) San Francisco, CA Hilton San Francisco

Preliminary Program for 2015 is linked here.

https://www.aeaweb.org/Annual_Meeting/index.php

BU affiliates, with duplicate names signifying each role time a name appears on the program.:

Ahmed Galal      Economic Research Forum and former Finance Minister of Egypt
Alfredo Burlando             University of Oregon
Alisdair McKay   Boston University
Andrew F. Newman       Boston University and CEPR
Angela Dills         Providence College
Austin Frakt        Boston University
Berardino Palazzo            Boston University
Carola Frydman                Boston University
Carola Frydman                Northwestern University
Cathie Jo Martin               Boston University
Ching-to Albert Ma         Boston University
Claudia Olivetti  Boston University
Claudia Olivetti Boston University
Daniele Paserman           Boston University
Dara Lee Luca    Harvard University and University of Missouri
Dara Lee Luca    University of Missouri and Harvard University
Dirk Hackbarth Boston University
Evgeny Lyandres              Boston University
Francesco Decarolis        Boston University
Giorgos Zervas Boston University
Giulia La Mattina              University of South Florida
Gustavo Schwenkler      Boston University
Hiroaki Kaido      Boston University
Ivan Fernandez-Val         Boston University
Jae W. Sim          Federal Reserve Board
James Rebitzer                 Boston University
Jerome Detemple           Boston University
Jianjun Miao      Boston University
Jing Guo               American Institutes for Research
Julie Shi                Harvard University
Kathleen Carey                 Boston University
Kehinde Ajayi    Boston University
Keith Marzilli Ericson       Boston University
Kevin Gallagher                Boston University
Kevin Lang          Boston University
Koichiro Ito         Boston University
Kristopher Gerardi          Federal Reserve Bank of Atlanta
Leslie Boden      Boston University
Marc Rysman     Boston University
Marcel Rindisbacher       Boston University
Martha Starr      American University
Megan MacGarvie           Boston University
Pasquale Schiraldi            London School of Economics
Phillip H. Ross    Boston University
Randall Ellis         Boston University
Robert Margo    Boston University
Rodolfo Prieto   Boston University
Rui Albuquerque              Boston University
Samuel Bazzi      Boston University
Sean Horan         Université de Montréal
Shinsuke Tanaka              Tufts University
Shulamit Kahn   Boston University
Silvia Prina           Case Western Reserve University
Simon Gilchrist Boston University
Stefania Garetto              Boston University
Timothy Layton                 Boston University
Yorghos Tripodis               Boston University
Yuan Tian             Boston University
Yuping Tsai          Centers for Disease Control and Prevention