Category Archives: Taxes

The unsurprising tragedies of the Afghanistan war

As we ponder the tragedies of the US withdrawal from Afghanistan, it is important to also remember the costs of our continuing. An excerpt from the Boston Globe is pasted in below.

The bottom line is that the wars in Afghanistan and Iraq will have cost the US at least $4 trillion dollars (excluding interest costs) which is 4 million million dollars. Given that the US has only 132 million households, this spending averages to over $30,000 per household, all paid for by debt we will eventually have to pay off (unlike previous wars, taxes were not increased).

$4 trillion could have instead been invested in free public university tuition, free health care for all children, reducing climate change, or the $4 trillion infrastructure bill that President Biden is asking for.

I commend President Biden for actually doing what presidents Bush, Obama and Trump all said they wanted to do but did not.

Joy and I have been listening to the audiobook “The Father of All Things: A Marine, His Son and the Legacy of Vietnam” which covers the fall of Saigon in Vietnam and subsequent events. There should be no surprise that the events in Kabul are the consequence of war. Even the speedy fall of the government.

The Father of All Things: A Marine, His Son – Amazon.com

https://www.amazon.com › Father-All-Things-Vietnam-…


Below is from The Boston Globe on Tuesday 8/16/2021.

Costs of the Afghanistan war, in lives and dollars

By ELLEN KNICKMEYER The Associated Press, Updated August 16, 2021, 5:00 p.m.


https://www.bostonglobe.com/2021/08/16/nation/costs-afghanistan-war-lives-dollars/

_________________________

The longest war:

Percentage of US population born since the 2001 attacks plotted by Al Qaeda leaders who were sheltering in Afghanistan: Roughly one out of every four.

The human cost:

American service members killed in Afghanistan through April: 2,448.

US contractors: 3,846.

Afghan national military and police: 66,000.

Other allied service members, including from other NATO member states: 1,144.

Afghan civilians: 47,245.

Taliban and other opposition fighters: 51,191.

Aid workers: 444.

Journalists: 72.

Afghanistan after nearly 20 years of US occupation:

Percentage drop in infant mortality rate since US, Afghan, and other allied forces overthrew the Taliban government, which had sought to restrict women and girls to the home: About 50. (RE note: Statistica still lists the IMR at 5% (“about 46.5 per 1000”) of all live births in 2019. This is still an abysmal rate: 1 in 20 infants are dying.)

Percentage of Afghan teenage girls able to read today: 37%. (RE note: World Bank data show it as roughly doubling since 2011. Still appalling.)

Oversight by congress:

Date Congress authorized US forces to go after culprits in Sept. 11, 2001, attacks: Sept. 18, 2001.

Number of times US lawmakers have voted to declare war in Afghanistan: 0.

Number of times lawmakers on Senate Appropriations defense subcommittee addressed costs of Vietnam War, during that conflict: 42

Number of times lawmakers in same subcommittee have mentioned costs of Afghanistan and Iraq wars, through mid-summer 2021: 5.

Number of times lawmakers on Senate Finance Committee have mentioned costs of Afghanistan and Iraq wars since Sept. 11, 2001, through mid-summer 2021: 1.

Paying for a war on credit, not in cash:

Amount that President Truman temporarily raised top tax rates to pay for Korean War: 92 percent.

Amount that President Johnson temporarily raised top tax rates to pay for Vietnam War: 77 percent.

Amount that President George W. Bush cut tax rates for the wealthiest, rather than raise them, at outset of Afghanistan and Iraq wars: At least 8 percent.

Estimated amount of direct Afghanistan and Iraq war costs that the United States has debt-financed as of 2020: $2 trillion.

Estimated interest costs by 2050: Up to $6.5 trillion.

The wars end. The costs don’t:

Amount Bilmes estimates the United States has committed to pay in health care, disability, burial and other costs for roughly 4 million Afghanistan and Iraq veterans: more than $2 trillion.

Period those costs will peak: after 2048.

Source of the above: Much of the data is from Linda Bilmes of Harvard University’s Kennedy School and from the Brown University Costs of War project. Because the United States between 2003 and 2011 fought the Afghanistan and Iraq wars simultaneously, and many American troops served tours in both wars, some figures as noted cover both post-9/11 US wars.


Impact of the GOP tax reform on tax-favored donations

This extended blog will mostly be of interest to Americans thinking about end of year tax strategies. It extends a discussion among some Yale colleagues about the current tax bill as well as some calculations based on web sources. This blog focuses on the new high standard deduction and the Alternative Minimum Tax (AMT) provisions, and what it means for charitable donations. Much of it is oriented toward income earners earning $150k-500k. There are of course many, many other features of the new tax bill not examined.

My glimpse at the new tax tables, included below, are that most people in the range from $150-500k will see tax cuts of their marginal rate of about 2-6%, unless they are affected by the AMT. Those affected by the AMT will see significant lump sum gains but marginal rates that are similar to this years, at 26 or 28 percent.

This discussion will be complex for many unless you are used to thinking about the tax subsidies for donations and the implications for timing of donation. (Most people donate because it just feels good.)

My bottom line is at the bottom of this email. COMMENTS/CORRECTIONS WELCOME.

I am not a tax expert and you should get expert advice before acting on anything you read here.

The standard deduction is proposed to be raised to $24,000 for a married couple filing jointly. More important are the AMT changes for high income people.

So under the new system a married couple can claim itemized deductions (look at Sch A of your return for last year for this amount) of a minimum of $24,000, ($12k if single) even if they have no itemized deductions.

The main itemized deductions for most people are mortgage interest, state and local income and property taxes, and charitable contributions.

Base case: Assume you don’t have any mortgage interest and your 2017 itemized deductions are say $40,000 in state income and property taxes, and $5,000 in charitable contributions:

Under current law you claim itemized deductions of $45,000 which is more than the standard deduction.

Under proposed 2018 law the allowable itemized deductions will be $10,000 state income and property taxes plus $5,000 for the donations. So if a person claims the standard deduction of $24,000 – he gets this regardless of whether he makes a charitable contribution of nil or $14,000.  So the first 14k of charitable deductions doesn’t produce a tax benefit.

Wrinkle 1:


If you have deductible mortgage interest next year (Say $10,000) from an existing first mortgage next year, then the interest on it can be added to your $10,000 of local property taxes and the threshold for donations affecting your taxes would be only $4000. Since 10k+10k+4k=$24,000.

Wrinkle 1a: home equity line of credit mortgage interest is no longer deductible at all.

Wrinkle 1b: for any new mortgages taken out after Dec 15, 2017, only the interest on the first $750k of home mortgage will be deductible.


Important Wrinkle 2:

If your income is subject to the alternative  minimum  tax (AMT) for 2017 then the marginal value of a deduction this year is either 26 or 28 percent, depending on where you are in the phase out of the AMT, since these are the AMT income marginal rates. Your AMT is calculated from your income without taking most deductions but after a moderately large exemption. The AMT is based on your Alternative Minimum Taxable Income AMTI (See intuitive discussion  below).  Call this Y. Taxes are applied to Y minus the AMT standard exemption, call it Z, which is $84,500 for joint filers and $54,300 for others. The exemption starts to phase out once your income exceeds Q=$160,900 for joint filers, and $120,700 for singles. Under the proposed new tax bill, the AMT exemption (Z) is increased and the point at which the exemptions begin to be phased out are increased, but the tax rates remain the same. Z is decreased by $.25 for each dollar  of AMTI above the phase out threshold Q.


The following focuses on joint filers and are based on a recent article by the Tax foundation (Link below).


Currently, if Y your AMT income is $160,900 then the AMT tax is

AMT=.26*(Y-Z) = .26*(160,900-84,500)=$19,864


If your AMT income is 250k then your AMT tax would be


Y=250,000

Q=160,900

Z = 84,500-.25(250,000-160,900)  (reflecting the phase out of the exemption starting at 160,900)

AMT=0.28*(Y-Z) = .28*(250000-62225) = $52,577


If your income is 500,000 at which the exemption Z is currently fully phased out, then your AMT would be

AMT = .28*(500000 – 0) = $140k.


(The .26 rate applies when your Y = AMTI is less than $187,800, while the “higher rate”  of 28% applies to more than that. This step also creates modest infra-marginal changes that I have ignored. Silly complexity…)


The current law raises the exemption amounts, and also raises the threshold at which the exemption starts to be  phased out.


“Exemption amounts under the conference agreement are increased from their current level of $84,500 for joint filers and $54,300 for other filers to $109,400 and $70,300, respectively.”


More importantly, the AMT exemption does not begin to phase out until alternative minimum taxable income exceeds $1 million for joint filing households. So for the three households just examined the new AMT amounts would be:


AMT only kicks in at AMTI >= 160,900.


At Y = 160,900: AMT=.26*(Y-Z) = .26*(160,900-109,400)=$13,390 a reduction of $6,474 from the existing AMT tax.

At Y = $250,000 AMT = .28*(Y-Z) = .28*(250,000-109,400)=$36,556 a reduction of $16,021

At Y=$500,000: AMT = .28*(Y-Z) = 0.28*(500,000-109,400) = $109,400 a reduction of $30,632

You can interpolate pretty well between these amounts using the following figure. The slight nonlinearity results from the change from 26% to 28% at Y=187,800.tax reform fig 1 2017
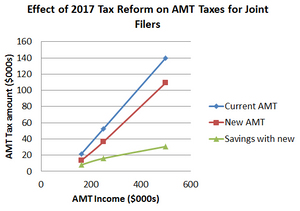
 

These AMT amounts are only relevant when they are more than the taxable income calculated using the normal way (using deductions and the standard exemptions). For many, these AMT changes are the gifts of the current tax reform.


So the AMT, which currently affects about half of all HH  with incomes above $200k is projected to affect a smaller number of people after the reform mostly because of the higher exemption.


This AMT change is a big cost component of the current reform, but gets less attention since it is harder to explain.


“All told, the Joint Committee on Taxation estimated that these [AMT] changes would reduce federal revenues by $637.1 billion over the next decade, compared to current law.” This is 42% of the total deficit increase!


https://taxfoundation.org/conference-report-alternative-minimum-tax/


Here is a brief, non-technical discussion of the Alternative Minimum Taxable Income AMTI.

Some of these items added back into your income include personal exemptions, state and local income taxes, miscellaneous itemized deductions and mortgage interest on home equity debt. Accordingly, you’re more likely affected by AMT if you have a high number of exemptions (a larger family), high state income and property taxes and/or high miscellaneous itemized deductions like significant investment management fees.

You may also have to include certain types of income that you wouldn’t normally count in your regular taxable income, such as exercising incentive stock options or tax-exempt interest from private activity bonds. The disallowance of deductions and addition of income leads to your Alternative Minimum Taxable Income (AMTI).

For 2017, you pay a tax rate of 26% on AMTI of $187,800 or less for those filing single, married filing jointly, head of household or qualify widower. For married filing separate taxpayers, the income threshold stops at $93,900.  The tax rate grows to 28% of income over those amounts. Multiplying your AMTI minus your exemption times the corresponding tax rate gives you your tentative minimum tax.

You may have some additional tax due if you reported capital gains distributions, qualified dividends, and/or used the foreign tax credit, but your software should add those for you.

You should note that AMT is only the difference between your regular income tax and the tentative minimum tax amount calculated through AMT. For example, if you owed $30,000 in regular income tax and your tentative minimum tax amount was $33,000, AMT of $3000 will show up on line 45 of your Form 1040.

https://www.forbes.com/sites/brianthompson1/2017/12/17/tax-reform-and-amt-what-you-should-know/#4c35e80f2081


Here is another discussion from CBSNews.


What's the deal with the alternative minimum tax?

For corporations, the AMT disappears.

That's not the case for individual filers, but fewer will have to pay it, at least.

  • Exemption amounts will increase from $84,000 for joint filers under the current law level to $109,400. Single filers will see that number increase from $54,300 to $70,300.
  • The exemption currently phases out for joint filers at $160,900, and $120,700 for individuals. Under the tax bill, that phaseout would kick in at $1 million for married filers and $500,000 for those who are single. Above the threshold, filers lose 25 percent of their exemption, that is, $0.25 on every dollar in income.

What if I give to charity?

The charitable deduction will remain as it is. So, if you itemize your deductions, you may be able to deduct charitable contributions that are made to qualifying organizations. According to the IRS, you may deduct up to 50 percent of your adjusted gross income, although some filers are limited to 20 percent and 30 percent.


https://www.cbsnews.com/news/gop-tax-bill-how-the-new-tax-plan-will-affect-you/


Here are the current “final” tax rates and intervals as of 10:30 am Tuesday morning.


https://www.cnbc.com/2017/12/15/find-your-new-tax-brackets-under-the-final-gop-tax-plan.html

See below for a breakdown of the proposed income tax brackets for singles.

Rate Taxable Income Bracket
10% 0 to $9,525
12% $9,525 to $38,700
22% $38,700 to $82,500
24% $82,500 to $157,500
32% $157,500 to $200,000
35% $200,000 to $500,000
37% $500,000 and up

Here are the proposed rates for married couples who file jointly.

Rate Taxable Income Bracket
10% 0 to $19,050
12% $19,050 to $77,400
22% $77,400 to $165,000
24% $165,000 to $315,000
32% $315,000 to $400,000
35% $400,000 to $600,000
37% $600,000 and up

For comparison, here would be the 2018 brackets under current tax law, adjusted for inflation.

Rate Taxable Income Bracket-Single Taxable Income Bracket-Married Filing Jointly
10% 0 to $9,525 0 to $19,050
15% $9,525 to $38,700 $19,050 to $77,400
25% $38,700 to $93,700 $77,400 to $156,150
28% $93,700 to $195,450 $156,150 to $237,950
33% $195,450 to $424,950 $237,950 to $424,950
35% $424,950 to $426,700 $424,950 to $480,050
39.60% $426,700 and up $480,050 and up


Here it is in a graph for joint filers. This assumes everyone just takes the standard deduction of $24,000.
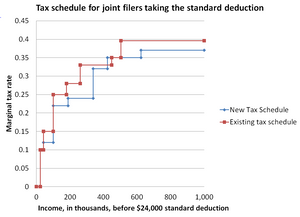
tax reform fig 2 2017

Of course, low income people are not likely to have deduction that exceed the $24,000 standard deduction while high income people are more likely to. Most of the changes are only visible at the higher income levels…


Putting together the new tax schedule with the new AMT taxes, and assuming joint filers only take the $24,000 standard deduction, the following reveals the key role that the new AMT plays.
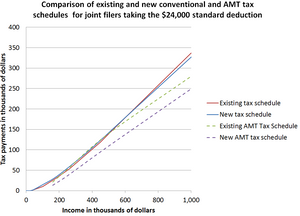
tax reform fig 3 2017


For people who have lots of possible deductions under the new tax system, the AMT places a much lower minimum on tax payments than the old one.

The new AMT schedule is substantially more attractive to high income salary earners affected by the AMT. The relevant tax rate for them is 28%.

Not shown in this figure is that eventually the difference between the existing and new AMT disappears at about $1.4 million.


My bottom line from this is:


In general, under the new tax program, bunching of charitable donations and concentration of deductions into a single year will be attractive, so that you  might take the standard deduction one year and not the next.


The AMT makes it unclear whether bunching in 2017 is particularly worthwhile relative to 2018, since the 26% or 28% rates in the AMT may be less than the new marginal rate next year when combined with a more favorable AMT in future years. In short, a large donation this year may mean that on the margin you only get a 26-28% tax subsidy, while a donation next year may have a 33-37% deduction for large donors with moderately high incomes (<$500k).


For salary earners not affected by the AMT, donations this year are likely to be more favored than next year, when the lower rates and higher thresholds for tax rates will matter.


If you want to take a deduction for a donation THIS YEAR but decide who it goes to next year, you could open a  Donor advised fund, such as at Fidelity.


My bottom, bottom line is that I don’t expect large tax savings from moving around deductions between this year and next if you are affected by the AMT. A good strategy is to give what feels right.


Of course, all of this is based on the current tax bill, which could change or not be passed…


Get TAX ADVICE BEFORE YOU RELY ON THIS INFORMATION!

(This warning is mostly to protect me in case I am wrong.)


ACA versus GOP plans side-by-side

This article from the LA Times by columnist Noam Levey links an update on earlier postings online that does a side-by-side comparison of ACA versus the GOP’s replacement AHCA plan. That posting provides the best concise overview I have seen of the latest GOP AHCA proposal. It will take 10 minutes to review/read. Randy

Here is the comparison

http://www.latimes.com/projects/la-na-pol-obamacare-repeal/


Here is the new article, which features specific effects.

http://www.latimes.com/la-na-pol-obamacare-repeal-chaos-20170625-story.html


From: Levey, Noam [mailto:Noam.Levey@latimes.com]
Sent: Sunday, June 25, 2017 9:44 PM
To: Levey, Noam
Subject: ICYMI: New article on the disruptive impact of the Senate repeal bill

Good day,

In case you missed it, I wanted to share my latest piece examining the potentially devastating impact of the recently released Senate legislation to roll back the Affordable Care Act.

The Republican architects of the bill, like their House counterparts, hail their legislation as a remedy for ills caused by the current law. But across the country, in physicians’ offices and medical centers, in state capitols and corporate offices, there is widespread fear the unprecedented cuts in the GOP bills would create even larger problems in the U.S. healthcare system, threatening to not only strip health coverage from millions, but also upend insurance markets, cripple state budgets and drive medical clinics and hospitals to the breaking point. As Tom Tom Priselac, chief executive of Cedars Sinai Health System in Los Angeles, told me: “These reductions are going to wreak havoc.”

Here is the link: http://www.latimes.com/la-na-pol-obamacare-repeal-chaos-20170625-story.html

I hope you find the piece interesting. Thank you, as always, for reading. All best,

-N

Noam N. Levey

National healthcare reporter

Los Angeles Times Washington Bureau

Tel: 202-824-8317

Cell: 202-247-0811

noam.levey@latimes.com

twitter: @NoamLevey

$147 Billion: The Economic Cost of Trump Racism

Bottom line:

Trump’s racism predicted to cost US households $147 billion in extra payments to the rest of the world.

Like many people, I am appalled by president Trump’s recent executive order banning refugees - and even US legal immigrants  - from seven predominantly Muslim countries from entering the country. In the process, Trump has also angered most of the world’s 1.6 billion Muslims, comprising about 23% of the global population. Many of these countries (e.g,. OPEC members) hold major financial assets in the US. President Trump has also been active about insulting Mexico and China, two other huge financial partners with the US.

Since Trump is a businessman, I am going to focus on why this racism is a really bad idea for the US economy.

According to US Treasury, US national debt held by the public as of last Friday, Jan 26, 2017 was 14.4 trillion dollars.  That is over $42,000 borrowed on your behalf per US resident. Last year (2016), the interest paid on that debt was $432 billion, or over $3,456 per American household  per year. (US census numbers estimate 125 million households currently). Of that total debt, about 34% is owned by international Investors, and we are paying them the interest on their holdings. So that is $1,175 per US household being paid out to foreigners last year before Trump became president.

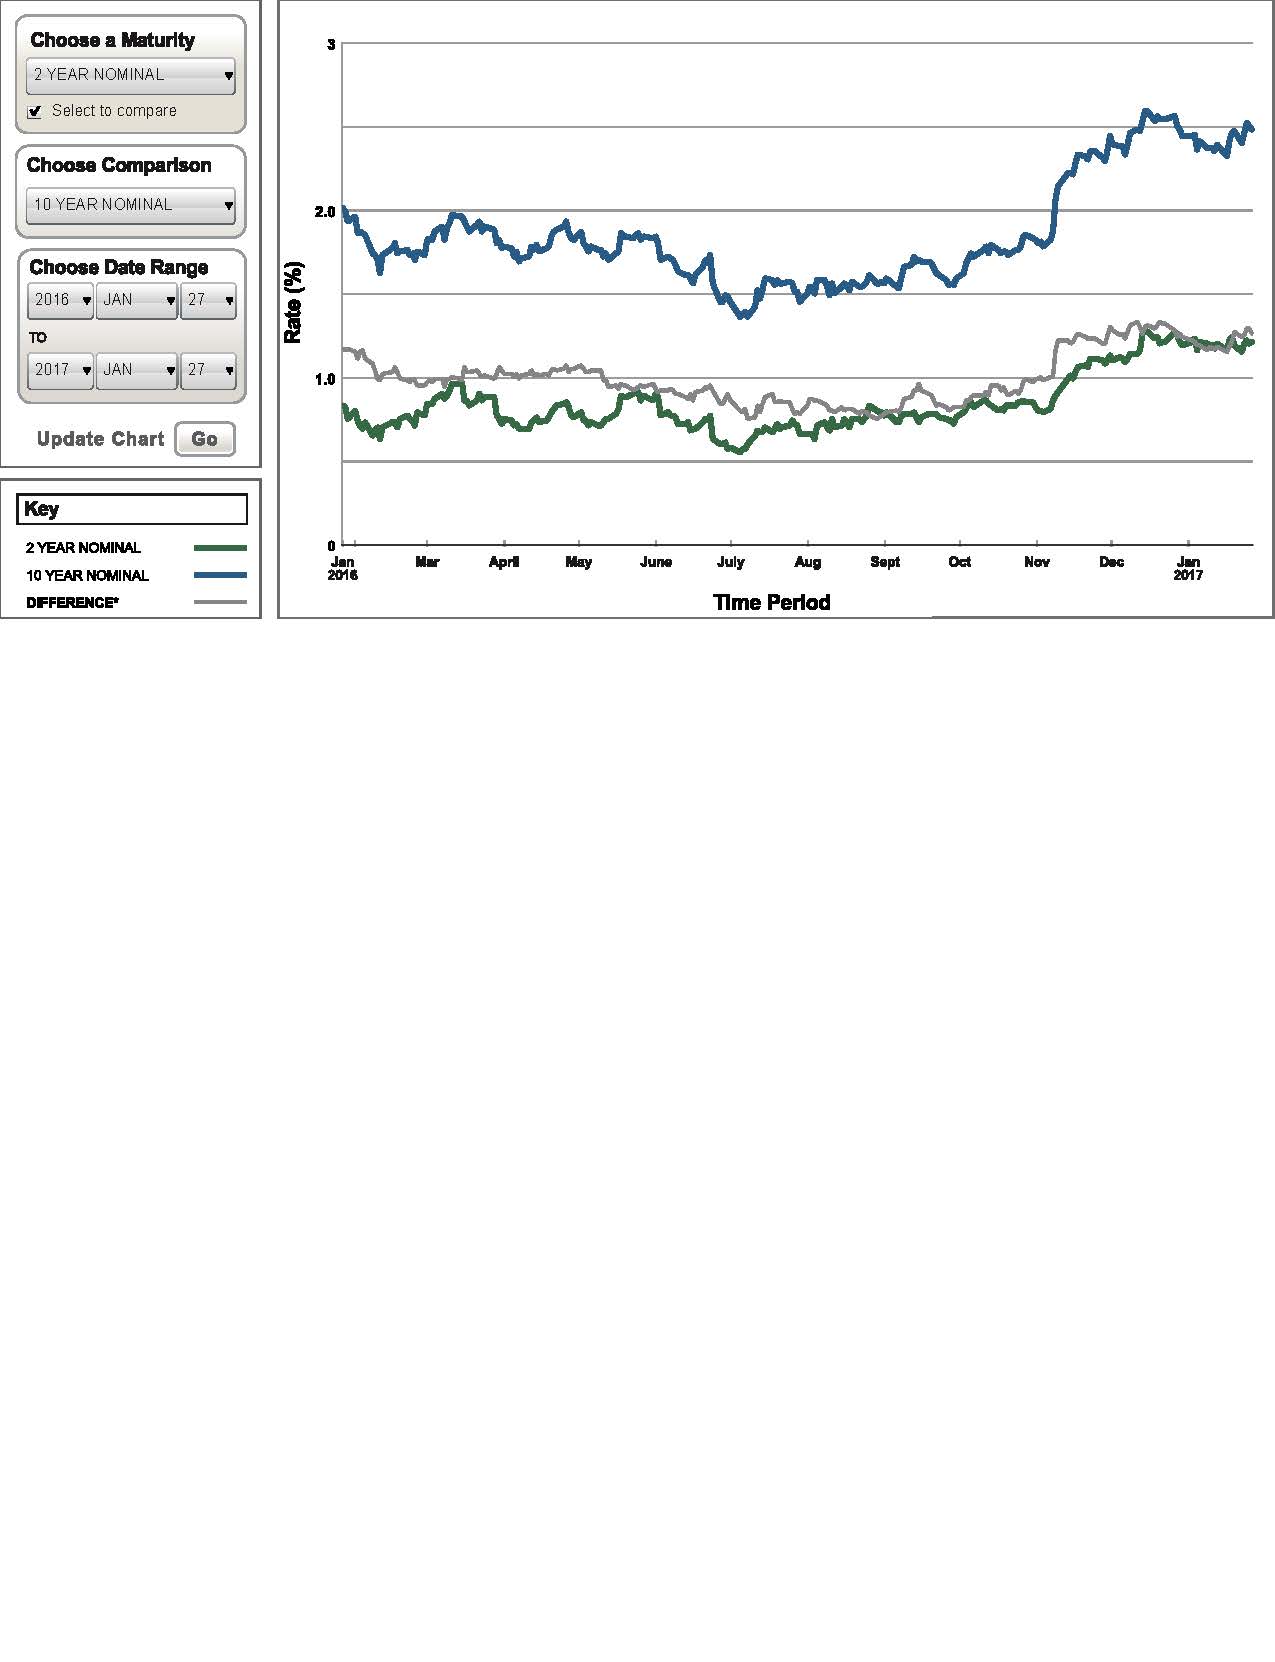
Although my good colleague Larry Kotlikoff worries that this level of debt, particularly to foreigners, is not sustainable, that is not what I want to focus on here. I want to focus instead on the CHANGE in these debt payments to foreigners that can be attributed to scary Trump’s racism. According to the current US Treasury documents, the long term interest rate has increased by more than a half percentage point since Trump was elected. Look at the figure yourself. The increase when Trump was elected was immediate. Even faster than the stock market advance.

https://www.treasury.gov/resource-center/data-chart-center/interest-rates/Pages/Historic-LongTerm-Rate-Data-Visualization.aspx

Increasing the interest rate on the national debt from 2 percent to 2.5 percent costs Americans an extra $294 per household EVERY YEAR until our debt is paid off, which will probably be never.

Now imagine that OPEC, or the Chinese, or the Mexicans decide that they are not so happy with the US anymore and decide to start dumping their $6.8 trillion of US debt. We should all expect that  Trumps racist policies will cause federal interest rates to increase to 4% per year, up another 2% above its rates before Trump. This doubling of US debt interest rates will result in an additional $1,175 per US household per year being paid out to foreigners. Or another $147 billion in total interest paid out to the rest of the world for our debts.

That is my prediction of what will happen if Trump does not change his racist policies.

Notice that I did not have to do any calculations based on the effects of Trump’s racism on foreign tourism in the US ($168 billion in 2012), spending on US universities by foreigners ($30 billion in 2015), or US exports to China  ($113 billion in 2015) or Mexico ($267 billion in2015).  Trump’s tax cuts and deficit spending policies are also likely to increase interest rates. It would be easy for much larger estimates to be generated.

Take home lessons:

  • Racist policies are bad ethically and bad for our economy.
  • There is a real danger of serious interest rate increases that will cost everyone a lot of money.
  • Bond prices are likely to fall and long term bonds seem like a poor investment choice.
  • It helps with your arguments if you use facts and citations instead of making things up.
  • So far, instead of having Mexico pay for Trump’s Stupid Wall, Trump's racist policies are making Americans pay more to Mexico and China and Iran and Saudi Arabia, and....

us-treasure-long-ten-year-interest-rates-2017-01-29


The US Should Ban or Heavily Tax Weapons Designed for Mass Shootings

Boston University Working Paper

Randall P. Ellis
Boston University,
Department of Economics
August 22, 2016
Abstract

This paper presents four arguments for why the US should ban or at least heavily tax the sale or transfer to civilians of weapons designed for mass shootings (WDMS), which would include most semi-automatic guns and weapons with large capacity magazines.

  1. The Supreme Court has repeatedly validated that second amendment protections of the right to bear arms do not apply to particularly dangerous weapons where protection of public safety overrides constitutional protections; this exclusion should apply to WDMS just as it does to machine guns and short-barreled shotguns.
  1. To make gun owners pay for the annual cost of deaths in the US due to guns, we should be taxing each gun owned at $1000 per year, or tax all gun sales (new or used) at $15,000 per gun sold. Given their higher killing power we should tax WDMS at $60,000 per gun sold. Or just ban them.
  1. In the last 36 months, there have been 5,399 people in the US killed or injured at mass shootings (where four or more people are shot, although not necessarily killed). Unless action is taken, the most recent trends suggest that there will be twice as many mass shootings in the US in five years.
  1. Current federal law for duck hunting bans the use of shotguns that hold more than three shells. If we care enough to ban four-bullet capacity guns to preserve ducks, then we should be willing to ban even higher capacity guns designed to kill people.

The full paper is linked here.

http://blogs.bu.edu/ellisrp/files/2016/08/Banning-or-heavily-taxing-WDMS-20160822.pdf

#6 Raise the minimum wage for jobs not offering health insurance

Time to change the policy discussion.

Congress has been unwilling to raise the minimum wage despite strong public support for doing so. This blog suggests a concrete approach for getting even broader public support and potentially reducing the need for federal taxes.

As of January 1, 2015 29 states and DC have minimum wages above the Federal minimum wage, which is still only $7.25 per hour. For a worker working 40 hours per week 50 weeks per year, the minimum wage yields only $14,500 per year, which is below the federal poverty level ($15,730) for a  family of two in 2014 in all states and DC. At these low income levels, even full time employees still cannot afford health insurance and will mostly be relying on large subsidies for health insurance  and the employee earned tax credit (EIT).  The insurance subsidy for a minimum wage worker enrolling in a private silver plan is currently at least $4,237 per year for an adult with one child, while the EIT is currently $3,359 for a single worker with one child if earning the minimum wage. Hence an employer paying only the minimum wage is counting on a subsidy from the government of at least $7596 per year for a worker with one child, which is $3.80 per hour.

A simple approach that will encourage more firms to offer health insurance is to raise the minimum wage required for any position that does not include any offer of subsidized health insurance. For concreteness I propose a minimum wage of $12 per hour without health insurance, versus $8 per hour with a job that includes subsidies for health insurance. (Those age 21 and under would also be eligible for the $8 per hour rate.) Whether the job is for 10, 30 or 40 hours per week does not matter, only whether there is subsidized health insurance. This four dollar per hour increment will encourage firms to bear the full cost of their workers, and reduce the burden on federal tax revenue and the budget.

In Massachusetts, the minimum wage just increased on January 1, 2015 from $8 to $9 per hour. The State's economy continues to do well, and I still see signs in retail windows showing help is still wanted. Plus we still have lots of low-cost food and retail stores and services. Reduced employment is not visible, and would likely be more than offset by the stimulatory effects of reduced taxes. I see no reason why we couldn't leave it up to states to decide whether they want to use the same or higher minimum wages for jobs with or without health insurance as long as the two minimums are reached.

In Australia, the minimum wage is US$ 13.84 (16.87 Australian dollars), everyone has national health insurance, and the unemployment rate is comparable to the US at 6.2 percent (November, 2014). We rather liked it when we were there in 2011 that our gardener and most restaurant workers were Australian citizens, who spoke English well, not low-paid foreigners and recent immigrants, as they are in the US.

As I write this blog, the US congress is debating whether to partially undo the employer mandate provisions of the Affordable Care Act by allowing firms to not have to pay any penalty for not offering health insurance for employees working less than 40 hours per week. The current standard is 30 hours per week. This would have a potentially disastrous effect since so many workers work about 40 hours and it would be easy for employers  to avoid the (modest) ACA penalties by reducing worker hours. Plus, without the employer mandate, many workers will remain uninsured. Having a higher minimum wage for jobs not offered health insurance will greatly weaken the incentive for firms to drop employee hours to avoid offering insurance coverage and eliminate the 40 versus 30 hours as an issue. In fact it would encourage firms to offer full- rather than part-time jobs with health insurance, reducing the need for public subsidies.

This minimum wage policy particularly makes sense if it is combined with the proposal in my next (future) blog #7 to eliminate all family health insurance policies, insure individuals not households, and have all children under age 21 be covered independently of their parent's insurance policy. Making all children eligible for the exchange coverage options regardless of their (parent's) income would be one possible approach.

Here are links to my four previous blogs from 2013 on Taxes and fiscal policies. Still the right direction.

#1 All Taxes and Budgets Should be Expressed as Dollars per Person

#2. Include Social Security and Medicare taxes when discussing tax burdens

#3 Tax Bads (or at least don’t subsidize them!)

#4 State Tax Rates are Not Related to State Income or Growth

#5 “Let the Children and Grandchildren Pay?”


Joe Stiglitz Essay on Martin Luther King and inequality

My colleague Michael Manove forwarded this article which is worth reading and pondering.

It is available directly at the New York Times at the link below. Two pages.

http://opinionator.blogs.nytimes.com/2013/08/27/how-dr-king-shaped-my-work-in-economics/?_r=0

The Great Divide August 27, 2013, 8:58 pm 167 Comments
How Dr. King Shaped My Work in Economics
By JOSEPH E. STIGLITZ

"I had the good fortune to be in the crowd in Washington when the Rev. Dr. Martin Luther King Jr.
gave his thrilling “I Have a Dream” speech on Aug. 28, 1963. I was 20 years old, and had just finished
college. It was just a couple of weeks before I began my graduate studies in economics at the
Massachusetts Institute of Technology..."

#5 “Let the Children and Grandchildren Pay?”

Time to Change the Tax Discussion #5

This is the  fifth and final posting in a five part series about taxes.

Every time congress passes legislation to increase public spending, they should have to specify which taxes they favor increasing to balance the budget. If not, then congress should have to openly discuss why they believe it is appropriate to LET THE CHILDREN AND GRANDCHILDREN PAY. If every unfunded benefit increase included this selfish labeling of the congressmen who voted for it, perhaps it would make it more stigmatizing to fight unfunded wars, increase discretionary spending (e.g., disaster relief) or resist Medicare payment increases without other spending cuts or tax increases.

Case in point: as I write this blog the House is debating how large the Hurricane Sandy relief fund should be, in the neighborhood of $50 billion ($160 per American). While I favor this expenditure, but I also favor committing to how we will pay for it (even if we only start next year...) This is a large enough expense that Congress should also be committing to the tax increase that will pay for it. For example 1% more income tax on the wealthy, or eliminating one subsidy or tax subsidy would do it. Note that ObamaCare legislation was forced to do this. It is possible.

Almost every Republican in Congress has signed Grover Norquist's No Tax Pledge not to increase any taxes, ever. This pledge is highly destructive of rational discussion of taxes and deficit reduction. I would be much happier if fiscally conservatives  instead signed a pledge not to increase our budget deficit ( and hence national debt) unless it is specifically part of an economic stimulus to deal with a potential or actual recession. Too often we have cut taxes even in times of a growing economy, effectively pushing onto our children and grandchildren (who do not even vote yet) the burden of paying for our overspending.

Increasing taxes will never be attractive, but why should we LET THE CHILDREN AND GRANDCHILDREN PAY?

Here are links to my four previous blogs on Taxes

#1 All Taxes and Budgets Should be Expressed as Dollars per Person

#2. Include Social Security and Medicare taxes when discussing tax burdens

#3 Tax Bads (or at least don’t subsidize them!)

#4 State Tax Rates are Not Related to State Income or Growth

#5 "Let the Children and Grandchildren Pay?"

#4 State Tax Rates are Not Related to State Income or Growth

Time to Change the Tax Discussion #4

This is the fourth in a five part series about taxes.

It has  become common in the media to argue that state income or sales taxes cannot be increased or it will dampen incentives and hurt the state or local economy. While this might be true at sufficiently high tax rates, there is no evidence that tax rates currently imposed on income or sales by states has any effect on the level or growth rates of the state economy. The following nine plots will let you decide for yourself whether there is any relation between

{Sales tax revenue, income tax revenue, or total state and local government revenue}

and

{Levels of Gross State Product per Capita, One year changes in Gross State Product (the "recovery") and Ten year changes in Gross State Product per Capita)

If there is, it is a very weak relationship, not worth worrying about. Instead we should be debating whether we want more or fewer government services relative to private goods.

All data used state-level rates as stored on the  web site http://www.usgovernmentrevenue.com maintained by Christopher Chantrill, self-described "writer and conservative".


I intentionally chose a strong title for this blog. My academic colleagues will reasonably argue that sales and income taxes DO have some dampening effect on a state economy. I do not disagree that there is some effect. But these graphs reveal that it is not detectable when it is realized that tax increases are used to pay for public services. For political decision-making, which of the following two statements is more nearly true? I would go with the latter.

Raising sales or income taxes by one percent in order to invest in bridges, public transit and education will have a meaningful negative effect on the state economy.

Raising sales or income taxes by one percent in order to invest in bridges, public transit and education will have a meaningful positive effect on the state economy.

Here are links to the previous three blogs on Taxes

#1 All Taxes and Budgets Should be Expressed as Dollars per Person

#2. Include Social Security and Medicare taxes when discussing tax burdens

#3 Tax Bads (or at least don’t subsidize them!)

#3 Tax Bads (or at least don’t subsidize them!)

Time to Change the Tax Discussion #3

This is the third in a five part series about taxes.

Introductory economics tells us that when the government taxes something, unless it is perfectly inelastically supplied or demanded, the tax will cause a distortion in a market and reduce the taxed activity. For most things (labor, profits, food, etc.) this reduction is considered a bad thing, and causes welfare losses. Yet taxes on BADS (i.e., goods with strong negative externalities) are welfare improving, since they reduce something that you want to reduce anyway.  Almost all economists will agree with this conceptually. Yet politicians and consumers are not forced to confront this reality. Perhaps economists could do a better job holding politicians accountable to this, by speaking out more. Here are six examples from recent policy debates. Why are economists not lining up behind these?

1. Tax the Sale of Guns.

The constitution asserts the right of people to own "arms" but says nothing about them being free or cheap. Econmists should favor taxing the sale of all guns, and even taxing the annual ownership of guns (similar to what we do for cars and housing) because of their large negative externalities. Higher taxes on more dangerous weapons (e.g. assault weapons), would also be appropriate. We could raise several billion dollars a year this way, and even earmark it for the extra medical care and law enforcement made necessary by the widespread ownership of guns. (In theory, I prefer not to earmark revenues, but history shows it is much easier to pass legislation if this is done, such as taxes on cigarettes. Hence in practice I support it.)

2. Tax Carbon

We will never have unanimous agreement that our excess carbon is a major cause of global warning, but we don't need to believe this unanimously to be willing to act on it. British Columbia (Canada) implemented a carbon tax in 2008 which is raising billions of dollars while nudging people to use less fuel. Look at two recent postings here

Climate Action Through a Tax Swap Describes a currrent initiative in Washington State to implement a state carbon tax. See numerous links within it.

More on BCs carbon tax shift. Posted in 2009 this discusses the reasons for the British Columbia's tax

3. Remove US Subsidies on Corn and Sugar

It is totally bizarre that at the same that we are thinking of taxing soft drinks for their sugar content, we are still spending billions on subsidizing corn (and hence high fructose corn syrup). US Department of Agriculture numbers show that in 2011 alone we spent 4.9 billion dollars subsidizing corn, which is  $16 per American. Visit the excellent website of  Environmental Working Group, which tracks agricultural subsidies and focus on Corn if you wish.

Remarkably, even farmers in Massachusetts benefit from the corn subsidy:

Corn Subsidies** in Massachusetts totaled $16.8 million from 1995-2011.

That works out to $4 per Massachusetts resident over 17 years. But the Massachusetts subsidy is nothing compared to Iowa which received

14.9 billion dollars ($4,866 per resident, or $286 per Iowa resident per year) over the same period. 2011 is not a particularly large outlier.

For further discussion of the serious problems with our crop insurance program consider this quote about US crop insurance.

"The most stunning evidence of the need to overhaul the current system is Dr. Babcock’s estimate that taxpayers
send $1 dollar to insurance companies and agents for every $1 dollar that goes to farmers."

Bruce Babcock "Giving It Away free: Free Crop Insurance Can Save Money and Strengthen the Farm Safety Net"
April 2012, (Professor of Economics at Iowa State University)

http://static.ewg.org/reports/2012/farm_bill/babcock_free_crop_insurance.pdf

4. Remove subsidies on US fossil fuel production, consumption, and depletion.

This follows from point #2 above. I know it is hard to do, but so is a Carbon Tax.

The surprising reason that Oil Subsidies Persist: Even Liberals Love them. Forbes, April 25, 2012.

We should not be subsidizing oil, coal and natural gas: 15.1 billion dollars in 2010 ($48 per American in 2010), according to OECD estimates.

5. Tax (more) people who do not purchase health insurance

As a health economist, I had to add at least one health related "bad".

The Affordable Care Act of 2010 includes provisions for taxing people who choose not to purchase health insurance, as it should, since they impose costs on the rest of us who do by: relying on charity care when they have emergency medical needs, relying on bankruptcy when they have high uninsured costs, and raising average premiums for insurance buyers since the people not buying insurance are on average healthier (and lower cost) than average. Hence this tax will be welfare improving, overall.

I thought about discussing/supporting taxes on obesity, smoking, or alcohol abuse, but see lots of problems with that, even those these are bads, often under the control of consumers.

6. Don't subsidize war

War is bad, and has a lot of negative externalities. (Yes, there are also some benefits.) In 2013 the US will spend $902 billion  on national defense (excluding police, fire, law and prisons). That is $2863 per American in 2013 alone on "defense". (Health and Education have mostly positive externalities.)

Brown University researchers maintain a web site on the cost of wars since 9/11

Here is one sobering sentence from a recent press release.

"The war bills already paid and obligated to be paid by the U.S. federal government as of fiscal year 2012 are $3.7 trillion in constant dollars."

That is $11,746 per US citizen...

There are many more bads that should be taxed and not subsidized, but I will end here.

For related discussion see the earlier blogs

#1 All Taxes and Budgets Should be Expressed as Dollars per Person

#2. Include Social Security and Medicare taxes when discussing tax burdens

Be Ready for the Trillion Dollar Coin!

In case you have not been paying attention, there is growing sentiment in favor of the Platinum Coin Seigniorage (PCS) and the Trillion Dollar Coin.

Here are two solid posts on it, one by economist Paul Krugman, the other by Philip Diehl, former director of the US mint .

The crux of the issue is that the debt ceiling,  created by legislation of our congress, is inconsistent with the powers enumerated in the constitution, specifically the fourteenth amendment.

Be Ready To Mint That Coin

http://krugman.blogs.nytimes.com/2013/01/07/be-ready-to-mint-that-coin/?smid=tw-NytimesKrugman&seid=auto

Co-author of platinum coin law weighs in on trillion dollar coin

http://www.dailykos.com/story/2013/01/08/1177211/-Co-author-of-platinum-coin-law-weighs-in-on-trillion-dollar-coin?detail=email

Here is the relevant sentence in section 4, of the 14th amendment of the US constitution.

Section 4. The validity of the public debt of the United States, authorized by law, including debts incurred for payment of pensions and bounties for services in suppressing insurrection or rebellion, shall not be questioned.

This amendment was passed in July 9, 1868 and "Section 4 confirmed the legitimacy of all United States public debt appropriated by the Congress." Wikipedia.

Here is the Wikipedia discussion of the issue, somewhat dated.

The issue of what effect Section 4 has regarding the debt ceiling remains unsettled.[52] Legal analyst Jeffrey Rosen has argued that Section 4 gives the President unilateral authority to raise or ignore the national debt ceiling, and that if challenged the Supreme Court would likely rule in favor of expanded executive power or dismiss the case altogether for lack of standing.[53] Erwin Chemerinsky, professor and dean at University of California, Irvine School of Law, has argued that not even in a "dire financial emergency" could the President raise the debt ceiling as "there is no reasonable way to interpret the Constitution that [allows him to do so]".[54]


#2 Include Social Security and Medicare taxes when discussing tax burdens

Time to Change the Tax Discussion #2

This is the second in a five part series on Taxes.

Far too much of the discussion of tax burdens has focused on the federal income tax rates while the federal payroll taxes - Social Security and the Medicare tax - get minor attention. This was epitomized by Mitt Romney's reference to 47 percent of Americans as not paying any taxes, when what he meant was not paying any Federal income taxes. This line of discussion ignores the fact that low income earners pay Social Security and Medicare taxes. Almost every economist would agree that these payroll taxes affect net pay and incentives in fundamentally the same way as income taxes and hence matter greatly. While true that these are earmarked taxes, they are nonetheless important contributions to federal revenue and affect deficits. In 2012 The federal income tax contributed 32 percent of total federal revenue, while social security and medicare payroll taxes contributed 23.9 percent.  Since these social insurance taxes are either proportional (Medicare tax) or regressive (SSI, since it stops after $110,000 in 2012), they substantially change the overall progressivity of the taxes. the following figure is from the Concord Coalition, based on US Treasury data.

https://spreadsheets.google.com/spreadsheet/oimg?key=0AqDf7XX8MI2BcGVxYmhHME92YWgtTXQ1bm84YTlpZkE&oid=2&zx=n74qil40ph5k

U.S. Treasury Department, Final Monthly Treasury Statement from Sept. 2012

http://www.concordcoalition.org/learn/budget/federal-budget-pie-charts

In an earlier blog (What are current marginal tax rates?), I calculated marginal tax rates for various levels of taxable income, which show that currently people earning $70,700 to $142,700 pay the highest marginal tax rates (38.1% including federal, SSI and Medicare taxes, higher if you add in Massachusetts income taxes).Warren Buffett basically referred to this same phenomenon when he said that his secretary paid higher taxes than he does on earned income.

Allowing the Bush tax cuts to expire will return those earning over $388,350 to paying the highest marginal rates (43.4% including the Medicare and ACA taxes).

For related discussion see the earlier blogs

#1 All Taxes and Budgets Should be Expressed as Dollars per Person

#2. Include Social Security and Medicare taxes when discussing tax burdens


All Taxes and Budgets Should be Expressed as Dollars per Person

Time to change the discussion #1

This is the first of five posts on my blog on how discussion of taxes and budgets in the US needs to change to improve decision-making.

Recent political debate and the media throws around costs of millions, billions and trillions of dollars even though there is no easy way for an ordinary citizen to evaluate the meaning of these terms. All of these are very big numbers. Consider the following numbers, sorted from largest to smallest. Which ones should we be worrying about?

Sample of recent numbers in the news (or that should be there)

$16.4 trillion US National Debt [1]

$3.7 trillion Total cost of wars in Iraq, Afghanistan and Pakistan [Reuters,2]

$1.2 trillion Size of tax increases and budget cuts in the fiscal cliff [3]

$1.1 trillion Federal deficit for 2012 [4]

$849 billion What is at stake in the Bush-era tax cuts for the wealthy, those earning more than $250,000, over ten years. [ABC news,5]

$ 807 billion The US government’s estimate of the direct cost of the war in Iraq thru FY2012. [6]

$ 571 billion The US government’s estimate of the direct cost of the war in Afghanistan and Pakistan thru FY2012 [6]

$ 100 billion Cost of the Iraq war that was used in discussions just before attacking Iraq [7]

$ 1.4 billion Financial spending for all presidential candidates, 2011-2012. [8]

$ 446 million The FY2013 annual budget for the Corporation for Public Broadcasting. [9]

$192 million The cost of the 2010 Newton North High School serving half of the Newton MA population [10]

$  83 million Campaigning expenses, all candidates including outside spending, on Elizabeth Warren vs. Scott Brown Massachusetts Senate race, 2012. [11]

$ 11 million Proposed tax override for Newton MA in 2013 to pay for schools [12]

$ 54,000 Cost of running the March special election to vote on the Newton override. [13]

The relevant populations

US population: 315 million people

MA population:  6.6 million

Newton population:  86,000 (half served by Newton North High School, the other by Newton South High School.)

Costs revisited with Ellis commentary


$ 52,000                US National Debt per Person -    High, but can be reduced if we try hard.

$12,000                 Total cost of wars in Iraq, Afghanistan and Pakistan per Person Not worthwhile to me, and 23% of our total US debt!

$ 3,800                  Per person size of the 2013 fiscal cliff, in taxes and reduced spending.

$ 3,500                  Extra cost per person per year to eliminate the federal deficit for 2012. Although similar to the preceding, note that this is for one year, while the above is over ten years… Even jumping over this cliff does not eliminate our deficit.

$ 2,700                  Ten-year cost per person of the Bush-era tax cut on those earning more than $250,000. A lot is at stake here, not small change.

$ 270 Average per year cost per person of Bush-era tax cut on >$250k Doesn't look like such a big number, and this is how much it reduces our per person annual deficit.

$13,500 Average per year cost per wealthy person (top 2%) of Bush-era tax cuts. Recall that the average income of this group is way higher than $250k

$ 2,600                  The official direct cost per person of the war in IraqWhy isn’t there more discussion of this?

$ 1,800                  Cost per person of the Afghanistan war. Maybe Afghan was worthwhile, but I doubt it.

$   317                    Initial cost per person of the Iraq war used in selling it to the public. How could we have been so wrong?

$       4                    Cost per person of the US presidential campaign. Maybe higher than I wish, but it is not going to break our budgets. Plus it is all voluntary, unlike the taxes.

$       1                    Cost per person of federal funding of public TV and radio. A small portion of their total budget. Why are we talking about this at all?

$4,500                   Cost per Newton resident of the Newton North High School. High, but I bet we more than made it back in increased property values. Even ignoring that more than half was funded by the state, if there are 4 people per household, then this is only 2.6% of median property value in Newton.

$    13                     Cost per Massachussetts resident of the 2012 Senate race. Seems reasonable expense for making big decisions. Plus it only happens every six years for each senate race, so only $2 per year per person.

$  128                     Cost per Newton resident per year of proposed tax override to help pay for schools. Definitely affordable.

$       .62                 Per person cost of running Newton’s March special election. Should not have even made the papers. Informed decision-making costs money.

Lessons

Big cost numbers are easier to understand when expressed as a cost per person.

Some big numbers don’t look very scary. Others look worse.

The numbers that get a lot of play in the media are not necessarily the right numbers.

Thought to Ponder: Why is it that almost no one in Newton is worried about having incurred a debt for one school in the amount of $4500 per resident, while citizens, and our Congress in particular, seems paralyzed to contemplate reducing our federal debt by a similar amount?

Citations

[1]  http://www.brillig.com/debt_clock/

[2] Reuter. 2012. Cost of war at least $3.7 trillion and counting.  http://www.reuters.com/article/2011/06/29/us-usa-war-idUSTRE75S25320110629 based on estimates from “Cost of War at http://costofwar.com/ which is sponsored by the National Priorities Project.

[5] http://abcnews.go.com/Politics/fiscal-cliff-bush-tax-cuts-expire/story?id=17907791#.UMnzFXfgztE

[4] http://www.gpo.gov/fdsys/search/pagedetails.action?packageId=BUDGET-2012-BUD

[5] http://abcnews.go.com/Politics/fiscal-cliff-bush-tax-cuts-expire/story?id=17907791#.UMoiRnfgztE

[6] Congressional Research Service, 2011. The Cost of Iraq, Afghanistan, and Other Global War on Terror Operations Since 9/11. http://www.fas.org/sgp/crs/natsec/RL33110.pdf updated continually at “Cost of War at http://costofwar.com/.

[7] Tom Russert Interview with Vice-President Dick Cheney, “NBC News’ Meet the Press," Transcript for March 16, 2003.https://www.mtholyoke.edu/acad/intrel/bush/cheneymeetthepress.htm

[8] Center for Responsive Politics, 2012.Most Expensive Races 2012 Overview

http://www.opensecrets.org/overview/index.php and

[9] Corporation for Public Broadcasting. 2012 Fiscal Year 2013 Operating Budget. http://www.cpb.org/aboutcpb/financials/budget/

[10] Newton Tab. 2012. Newton North High School final cost $6M less than expected. http://www.wickedlocal.com/newton/news/x1334618956/Newton-North-High-School-final-cost-6M-less-than-expected#ixzz2EwkW8uLrhttp://www.wickedlocal.com/newton/news/x1334618956/Newton-North-High-School-final-cost-6M-less-than-expected#axzz2EwkHptlI

[11] Center for Responsive Politics, 2012.Most Expensive Races 2012 Overview http://www.opensecrets.org/overview/topraces.php?cycle=2012&display=allcandsout

[12] http://www.newtonma.gov/gov/executive/override.asp

[13] Newton Tab, December 12, 2012. Table showing breakdown of the various costs of the special election in March, 2013 on the override.