Recommended book on US health care system

I highly recommend this book as a useful summary of the US Health Care System. I have made it required reading (as a reference) for my classes at BU.

The Health Care Handbook: A Clear and Concise Guide to the United States Health Care System, 2nd Edition Paperback – November 15, 2014

by Elisabeth Askin (Author), Nathan Moore (Author)


Paper:  $15.99

http://www.amazon.com/gp/product/0692244735

Electronic: $8.99

http://www.amazon.com/Health-Care-Handbook-Concise-United-ebook/dp/B00PWQ93M8/


Useful Data Links to US Government data

Websites for Federal Administrative Data sets:

US Administration for International Development:
Foreign aid from the U.S: Data and Tools

Department of Agriculture:
Economic Research Services: Supplemental Nutrition Assistance Program (SNAP) Data System
Food and Nutrition Services: Commodity Supplemental Food Program Data
Food Safety Inspection Services: Recalls and Quarterly Enforcement Reports
Forest Inventory Data
National Agricultural Statistics Service: Cropland Data
Natural Resource Conservation Service: Conservation Financial Assistance Programs' Enrollment Data
Risk Management Agency (RMA): Program Costs and Outlays Data
RMA: Actuarial Data
Web Based Supply Chain Management Reports Data

US Army:
Army Corps of Engineers: U.S. Waterborne Commerce Data

Department of Commerce:
Bureau of Economic Analysis (BEA): Foreign Direct Investments Data in the US
BEA: US National Income and Product Account (NIPA) Data
Economic Development Administration: Program Data
Census: Business Register Data and Longitudinal Business Database
Census: Longitudinal Employer-Household Dynamics
Census: County and Zip Code Business Patterns
International Trade Administration (ITA): U.S. Exporting Companies Data
ITA: Export-Supported Employment Data
ITA: Visitors Arrivals Program (Form I-94) Data
ITA: International Air Travel Statistics ( Form I-92) Program Data
National Climate Data Center: National climate and historic weather data
National Marine Fisheries Service: Recreational Fisheries statistics or Commercial Fisheries Statistics

Commodities Futures Trading Commission:
Filings, transactions, and other data
Market Report Data

Consumer Financial Protection Bureau:
Credit Card Agreement Database
Consumer Complaint Database

Consumer Product Safety Commission:
Injury Statistics

Department of Education:
Civil Rights Data for Public Schools
EDFacts Data for K-12 Educational Programs
National Center for Education Statistics: Common Core of Data on Public School
Federal Student Aid Data
National Reporting System Data for Adult Education
Nation’s Report Card System Data

Department of Energy:
Energy Information Administration (EIA): Energy Prices Data
EIA: Renewable Energy Market Data
EIA: Crude Oil Production and Stocks Data

Environmental Protection Agency:
Air Quality Data
Enforcement Dockets data
National Pollutant Discharge Elimination System (NPDES) permits and compliance data
Toxic Substances Control Act Chemical Substance Inventory
Superfund Sites (CERCLIS database)

Equal Employment Opportunity Commission
Enforcement and Litigation Statistics on Employment Discrimination

Federal Court System:
Bankruptcy Statistics

Federal Deposit Insurance Corporation:
Industry Data
Failed Bank Data

Federal Emergency Management Agency:
Assistance Record Data

Federal Financial Institutions Examination Council:
Financial and Structural Data for FDIC-insured Institution
Home mortgage loans data
Reinvestment Act Data

The Federal Reserve:
Consumer Credit data
Finance Companies Data
Foreign exchange rates
Government Receipts for Expenditures and Investments
Money Stock Measures
Treasury Account Series data

Federal Trade Commission:
Fraud and Identity Theft aggregates (Consumer Sentinel Network)

Fish and Wildlife Services:
Wetlands Data

General Services Administration:
Federal Procurement Report Data
FFATA Sub-award Reporting System (Data Reporting)
Small Business Goaling Report

Department of Health and Human Services:
Agency for Substances and Disease Registry (ASTDR): Environmental Health Webmap Data
ASTDR: Hazardous Substances Emergency Events Surveillance Report Data
ASTDR: National Toxic Substance Incidents Program Data
Center for Disease Control and Prevention (CDC): Community Water Fluoridation Statistics 
CDC: National Program of Cancer Registries Data
CDC: Surveillance Data
Center for Medicare and Medicaid Services (CMS): Medicare Claims Data or Microdata
CMS: National Health Expenditures Data
CMS: Provider of Service Data
National Directory of New Hires Data
National Center for Health Statistics: Vital Statistics: Births, Deaths, Marriages, Divorces
Temporary Assistance to Needy Families Administrative Records

Department of Homeland Security:
Immigration Statistics

Department of Housing and Urban Development:
Community Development Block Grants Expenditures Data
Family Data on Public and Indian Housing and Microdata
Fair Market Rents Data
Government Sponsored Enterprise Data
Metropolitan Area Quarterly Residential and Business Vacancy Report Data
National Low Income Housing Tax Credit Database
Neighborhood Stabilization Program Data
Program Income Limits Data

Department of Interior:
US Geological Survey (USGS): Biodiversity, Species data
USGS: Land Cover and Land Use data
USGS: Water Resources data
USGS: Water Quality Data

International Trade Commission:
Tariffs Databases

Department of Justice:
Bureau of Prison: Inmate, Population, and Staff Statistics
Bureau of Justice Statistics(BJS): Court Statistics Project Data
BJS: Federal Justice Statistics Program Data
BJS: Law Enforcement Management and Administrative Statistics
BJS: National Corrections Reporting Program Data
BJS: National Incident-Based Reporting System Data
BJS: National Prisoner Statistics Program Data
Federal Bureau of Investigation: Uniform Crime Reports Data

Department of Labor:
Bureau of Labor Statistics: Quarterly Census of Employment and Wages
Foreign Labor Certification Office: H-1B Data
Labor Retirement and Welfare Benefit Plan Data Set
(Form 5500)
Occupational Safety and Health Administration (OSHA): Work-Related Injury or Illness Data
OSHA: Enforcement Data (Inspection Data)
OSHA: Worker Fatalities/Catastrophes Report (FAT/CAT) 

National Aeronautics and Space Administration:
Urban Landsat

Patent and Trademark Office:
U.S. Patent and Trademark Office patent data

Department of Transportation:
Bureau of Transportation (BTS): Air Carrier Statistics
BTS: Intermodal Passenger Connectivity Database
Maritime Administration: Maritime Travel and Transportation Statistics

Department of Treasury:
Bureau of Fiscal Service: Public Debt Report
Financial Crime Enforcement Network: Mortgage and Real Estate Fraud Data Set
Interest Rate Statistics
Internal Revenue Service (IRS): Corporate Tax Statistics (Form 1120)
IRS: Employee Benefit Plans (Form 5500)
IRS: Individual Tax Statistics (Form 1040)
IRS: Quarterly Payroll Taxes (Form 941)

Securities and Exchange Commission:
Filings
Mutual Fund Fees and Expenses
Program and Market Data
Short Sale Volume Data 

Small Business Administration:
Small Business Lender and Loan Data
Social Security Administration:
Social Security Programs Data
Earnings and Employment Data for Workers Covered under Social Security and Medicare

Department of Veteran's Affairs:
Veterans Benefits Administration Reports
National Pollutant Discharge Elimination System (NPDES) permits and compliance data

Websites for Agency Procedures on Access to Restricted-Use Administrative Data Sets:

Bureau of Labor Statistics Confidential Data Sets Access
Census Bureau Restricted Restricted Data Sets Access
Agency for Healthcare Research and Quality Restricted Use Data Access
National Center for Health Statistics Restricted Use Data Access
National Center for Education Statistics Restricted Use Data Licenses
Bureau of Transportation Statistics Restricted-Release Airline Data Access
USDA's Economic Research Service Agriculture Resource Management Survey Data Access
National Institute on Aging Restricted Data Access
Center for Medicare and Medicaid Limited Data Access
Social Security Administration Health and Retirement Study Data Access
National Science Foundation/National Center for Science and Engineering Statistics Restricted-Use Data Access
Substance Abuse and Mental Health Data Archive

Re-envisioning Ebola, including updated story about Nigeria from Kas Nwuke

Arlene Ash, Professor and Division Chief, Biostatistics and Health Services Research, at UMass Medical School, has compiled a useful series of original thoughts, emails, and links about Ebola which I am broadcasting and reposting on my blog site here.

This posting repeats some of the information already posted in my earlier blog:

Ebola is being contained in Nigeria

The original article by Kas Nwuke is now linked (with permission) as a pdf and includes linked references on my web site. (It is 6 pages – updated to include two pages of references.)

Containing Ebola: A success story from an “unexpected” place?

From Arlene Ash:

Friends and Colleagues,

Here’s what I [Arlene Ash] sent previously with some updates.

I now have Mead Over’s permission to circulate his text that is included below, plus sharing the link to his Twitter log: @MeadOver.

Also, I have added the text from yesterday’s NYT editorial “Cuba’s Impressive Role on Ebola,” since non-subscribers may not be able to get it themselves on-line.  The full text, with links and commentary, is very interesting, and I think important.

These are, indeed, extraordinary times – and, I firmly believe, they offer an extraordinary opportunity to discard old, dysfunctional paradigms – if only we can seize it.

Arlene

_

Last weekend I [Arlene Ash] wrote:

Re-envisioning Ebola as an opportunity

Friends, If you like this idea as well as I do, perhaps you can help make it “go viral.”

  •  I believe it would be cheaper to stop Ebola in Africa than to try to seal our borders against it as it spreads unchecked.
  • I believe that taking a leadership role in stopping Ebola would do a great deal for our self-esteem as a nation, and for our regard in the world.
  • I believe that cost-effectiveness calculations could make a strong case for a “war on Ebola” as the best kind of war that we could wage. I propose we could do more to combat ISIS and protect America by working with the world community to prevent the spread of Ebola in Africa than by any level of commitment of troops and weapons to the enflamed Middle East.

I want America to re-envision Ebola as an opportunity to demonstrate what great things we can do when we bend ourselves to the task.

Of course we are all busy, but perhaps it takes only a little help from many people to spread a really good idea.

Thought for the day. Please grow it and pass it along.

_

I got back some very interesting feedback which I would like to share:

From Randy Ellis (a success story in Nigeria, with lessons for the rest of the world):

Amid so much negative and scary news about Ebola, this research paper on the experience of Nigeria where it has not spread widely after arriving by airplane gives great hope. I recommend it if you have time (It is 6 pages).

Containing Ebola: A success story from an “unexpected” place? [Now linked instead of attached as a pdf]

The author, Kasirim Nwuke  is a BU Ph.D. Here is his bio from one web site.

http://www.elearning-africa.com/profiles/profile_popup.php?address_id=595692&lang=4

_

Then a follow-on from Mead Over, author of a World Bank report (Twitter log  @MeadOver):

This is indeed a good story with details that go beyond the information our World Bank report (in the box on page 29) on the efforts of Senegal and Nigeria that I co-authored on October 7 and blogged on Friday:

http://www.cgdev.org/blog/understanding-world-banks-estimate-economic-damage-ebola-west-africa

http://documents.worldbank.org/curated/en/2014/10/20270083/economic-impact-2014-ebola-epidemic-short-medium-term-estimates-west-africa

The box on page 29 of the WB report was requested by JYK after he sat next to Goodluck Jonathan at the UNGA meeting last week and President Jonathan told him that 1,000 Nigerian public health workers were involved in the contact tracing including almost 300 Nigerian doctors.  This is remarkable not only for the level of effort, but also in comparison to Liberia, Sierra Leone and Guinea each of which had fewer than 100 doctors before the crisis.  In Nigeria I have heard that the polio eradication workers are the ones who were redeployed to do the Ebola contact tracing.  Other countries don’t have the polio program because they don’t have polio.  So even a relatively wealthy country like Ghana may have trouble emulating Nigeria’s success.

I like the point made in the article that Nigeria showed courage in announcing the danger far and wide and rolling out a massive public health effort to contain it.  This was before the rest of the world was taking the epidemic as seriously as they are today, and thus the measures could well have been opposed by economic interests.  (Parallel to HIV:  In the early days of the HIV epidemic, business interests in Thailand opposed the admission that HIV was a problem.  In “Confronting AIDS” we attribute Thailand’s energetic and remarkably successful “100% condom program” partly to the fact that the country was under a military dictatorship for 6 months and the “benevolent dictator” saw the wisdom of opposing the economic interests in order to start that program.)

When I spoke on Ebola at American University the other evening, one of the other panelists was an anthropologist who had recently returned from Sierra Leone.  She also reported the “Ebola handshake” and other “self-isolation behavior from that country.  Epidemiologists are hoping that such behavior, developing in response to the news and the public information campaign, will reduce the reproductive rate of the epidemic.  But we have not seen a deceleration in Liberia or Sierra Leone yet.

Another implication of the author’s account and of the Nigerian and Senegalese public health expenditure amounts reported in the box of the World Bank report is that several West African countries are increasing government spending in response to the outbreak (as is the US).  Our World Bank report does not include the possible stimulus effect of this spending on national economies.  This spending may offset some of the reduction in aggregate demand due to aversion behavior, and thus reduce the economic impact below our estimates.  However, as I say at the end of my blog, unless the epidemic begins to decelerate soon, our “High Ebola” estimate may fall short of estimating the total impact.  And I hope that when Charles Kenny and I join CDC and others in asserting this is still a small problem inside the US, we are not being overly optimistic.  As here:

https://www.youtube.com/watch?v=_jCWkDYwN2g; https://www.youtube.com/watch?v=113kLL3pZQQ

One frustrating aspect of the report by Kasirim Nwuke is the lack of references or hyperlinks [AA: they are now attached in a separate file.]  Even our World Bank report did better.  I agree totally with his conclusion that Nigeria is not yet “safe”.  Each day is another roll of the dice.  In one sense, Nigeria was lucky that they detected the first case on entry.  Next time they may not be so lucky.

_

In response, Kas Nwuke KNwuke@uneca.org wrote (on 10/18/14):

Going through the materials, I have come to know that Nigeria's preparations started much earlier. It started once the outbreak in Guinea and reached full steam after the July ECOWAS Heads of State Summit.  That Summit discussed Ebola in the sub-region and resolved that member States of ECOWAS should be prepared to contain it.  Nigeria according to the Health Minister made, after the Summit, the very first financial donation of $3.5 million US to the three countries.  Back home, the Health Minister briefed the Commissioners for Health in the 36 States of the Federation and asked for increased vigilance.


You will find this additional information in the references.


In my essay, I had given the number of Nigerians who have volunteered to go to Liberia and Sierra Leone as 200.  I have since learned that the number is actually 591.  In addition, Nigeria is also providing crash courses to health personnel from the three most affected countries.


I am sure that lots more will be written about Nigeria experience.  I hope that the lesson can be of value to resource constrained countries on how to handle/tackle epidemics in the future.


(I must with regret inform you that Nigeria's election politics has now entered the Ebola debate.  Rivers State and Lagos State are controlled by the opposition.  Electioneering campaign for next year's election has started and the ruling PDP and the opposition APC is each seeking to claim credit for the success in containing the spread of Ebola.  The Rivers State Governor has just disclosed - see the hyperlink - that the state spent N1.106 billion - more than $6 million - to tackle Ebola.)


With best wishes,


Kas

-

Also, some inspiring information about a UMass colleague (Steven Hatch) now in Liberia:

http://www.nytimes.com/2014/10/17/world/africa/pursuing-a-calling-that-leads-to-west-africa.html

http://www.nytimes.com/2014/10/17/world/africa/ebola-liberia-west-africa-epidemic.html

and a NYT “conspicuous success story” about Senegal, that points to the so far very positive Nigerian experience as well.

-

Also,

NYT, October 19 Op-Ed: “Cuba’s Impressive Role on Ebola” (http://www.nytimes.com/2014/10/20/opinion/cubas-impressive-role-on-ebola.html?_r=0)

Cuba is an impoverished island that remains largely cut off from the world and lies about 4,500 miles from the West African nations where Ebola is spreading at an alarming rate. Yet, having pledged to deploy hundreds of medical professionals to the front lines of the pandemic, Cuba stands to play the most robust role among the nations seeking to contain the virus.

Cuba’s contribution is doubtlessly meant at least in part to bolster its beleaguered international standing. Nonetheless, it should be lauded and emulated.

The global panic over Ebola has not brought forth an adequate response from the nations with the most to offer. While the United States and several other wealthy countries have been happy to pledge funds, only Cuba and a few nongovernmental organizations are offering what is most needed: medical professionals in the field.

The Cuban health sector is aware of the risks of taking on dangerous missions. Cuban doctors assumed the lead role in treating cholera patients in the aftermath of Haiti’s earthquake in 2010. Some returned home sick, and then the island had its first outbreak of cholera in a century. An outbreak of Ebola on the island could pose a far more dangerous risk and increase the odds of a rapid spread in the Western Hemisphere.

Cuba has a long tradition of dispatching doctors and nurses to disaster areas abroad. In the aftermath of Hurricane Katrina in 2005, the Cuban government created a quick-reaction medical corps and offered to send doctors to New Orleans. The United States, unsurprisingly, didn’t take Havana up on that offer. Yet officials in Washington seemed thrilled to learn in recent weeks that Cuba had activated the medical teams for missions in Sierra Leone, Liberia and Guinea.

With technical support from the World Health Organization, the Cuban government trained 460 doctors and nurses on the stringent precautions that must be taken to treat people with the highly contagious virus. The first group of 165 professionals arrived in Sierra Leone in recent days. José Luis Di Fabio, the World Health Organization’s representative in Havana, said Cuban medics were uniquely suited for the mission because many had already worked in Africa. “Cuba has very competent medical professionals,” said Mr. Di Fabio, who is Uruguayan. Mr. Di Fabio said Cuba’s efforts to aid in health emergencies abroad are stymied by the embargo the United States imposes on the island, which struggles to acquire modern equipment and keep medical shelves adequately stocked.

In a column published over the weekend in Cuba’s state-run newspaper, Granma, Fidel Castro argued that the United States and Cuba must put aside their differences, if only temporarily, to combat a deadly scourge. He’s absolutely right.
 

Ebola is being contained in Nigeria

Amid so much negative and scary news about Ebola, this research paper on the experience of Nigeria where it has not spread widely after arriving by airplane gives great hope. I recommend it if you have time (It is 6 pages - updated to include references.).

Containing Ebola: A success story from an "unexpected" place?

The author, Kasirim Nwuke  is a BU Ph.D. Here is his bio from the elearning-aftrica web site.

http://www.elearning-africa.com/profiles/profile_popup.php?address_id=595692&lang=4

Kasirim Nwuke

Kasirim Nwuke is Chief, New Technologies and Innovation at the United Nations Economic Commission for Africa (ECA), Addis Ababa, Ethiopia. He has thought in a number at a number of higher education institutions in the United States of America including Tufts University, Medford, MA; Wellesley College, Wellesley, MA, and Northeastern University, Boston, MA. He been a Research Associate at Harvard University School of Public Health and the a Fellow in African Studies at the African Studies Centre, Boston University. He has held different positions at the United Nations Economic Commission for Africa and as Senior Economic Adviser to the Minister of Finance of the Federal Republic of Nigeria. Kasirim is the author (or lead author) of several research papers and reports and policy briefs on African economic development.  Among books to which he has been a contributing author is "AdricaDotEdu: IT Opportunities and Higher Education in Africa" Maria Beebe et al. Kasirim holds a PhD in Economics from Boston University, Boston, MA.

Former BU professor and World Bank senior economist Mead Over has also been blogging on ebola in west africa. Here is one of his recent blogs.

http://www.cgdev.org/blog/understanding-world-banks-estimate-economic-damage-ebola-west-africa

http://documents.worldbank.org/curated/en/2014/10/20270083/economic-impact-2014-ebola-epidemic-short-medium-term-estimates-west-africa


Important Reposting on Placebo surgery from TIE

I am forwarding this excellent TIE post since every health researcher and indeed every consumer should realize how serious the lack of evidence is on many common surgical procedures. Here are some quotes organized in a succinct way.

"2002... arthroscopic surgery for osteoarthritis of the knee ... Those who had the actual procedures did no better than those who had the sham surgery. " (We still spend $3 billion a year on this procedure)
"2005... percutaneous laser myocardial revascularization, ...  didn’t improve angina better than a placebo"
"2003, 2009, 2009... vertebroplasty — treating back pain by injecting bone cement into fractured vertebrae ... worked no better than faking the procedure."
"2013 ... arthroscopic procedures for tears of the meniscus cartilage in the knee... performed no better than sham surgery" (We do about 700,000 of them with direct costs of about $4 billion.)
"[2014] ... systematic review of migraine prophylaxis [prevention], while 22 percent of patients had a positive response to placebo medications and 38 percent had a positive response to placebo acupuncture, 58 percent had a positive response to placebo surgery.
"2014... 53 randomized controlled trials that included placebo surgery as one option. In more than half of them ... the effect of sham surgery was equivalent to that of the actual procedure."

If you are getting surgery done, do your own research on it and ask questions!


-------- Original Message --------

Subject: “The Placebo Effect Doesn’t Apply Just to Pills” plus 1 more
Date: Thu, 9 Oct 2014 11:13:06 +0000
From: The Incidental Economist <tie@theincidentaleconomist.com>
To: <ellisrp@bu.edu>

“The Placebo Effect Doesn’t Apply Just to Pills” plus 1 more


The Placebo Effect Doesn’t Apply Just to PillsPosted: 09 Oct 2014 04:00 AM PDT

The following originally appeared on The Upshot (copyright 2014, The New York Times Company).

For a drug to be approved by the Food and Drug Administration, it must prove itself better than a placebo, or fake drug. This is because of the “placebo effect,” in which patients often improve just because they think they are being treated with something. If we can’t compare a new drug with a placebo, we can’t be sure that the benefit seen from it is anything more than wishful thinking.

But when it comes to medical devices and surgery, the requirements aren’t the same. Placebos aren’t required. That is probably a mistake.

At the turn of this century, arthroscopic surgery for osteoarthritis of the knee was common. Basically, surgeons would clean out the knee usingarthroscopic devices. Another common procedure was lavage, in which a needle would inject saline into the knee to irrigate it. The thought was that these procedures would remove fragments of cartilage and calcium phosphate crystals that were causing inflammation. A number of studieshad shown that people who had these procedures improved more than people who did not.

However, a growing number of people were concerned that this was really no more than a placebo effect. And in 2002, a study was published thatproved it.

A total of 180 patients who had osteoarthritis of the knee were randomly assigned (with their consent) to one of three groups. The first had a standard arthroscopic procedure, and the second had lavage. The third, however, had sham surgery. They had an incision, and a procedure was faked so that they didn’t know that they actually had nothing done. Then the incision was closed.

The results were stunning. Those who had the actual procedures did no better than those who had the sham surgery. They all improved the same amount. The results were all in people’s heads.

Many who heard about the results were angry that this study occurred. They thought it was unethical that people received an incision, and most likely a scar, for no benefit. But, of course, the same was actually true for people who had arthroscopy or lavage: They received no benefit either. Moreover, the results did not make the procedure scarce. Years later, more than a half-million Americans still underwent arthroscopic surgery for osteoarthritis of the knee. They or their insurers spent about $3 billion that year on a procedure that was no better than a placebo.

Sham procedures for research aren’t new. As far back as 1959, the medical literature was reporting on small studies that showed that procedures like internal mammary artery ligation, a surgical procedure used to treat angina, were no better than a fake incision.

In 2005, a study was published in the Journal of the American College of Cardiology proving that percutaneous laser myocardial revascularization, in which a laser is threaded through blood vessels to cut tiny channels in the heart muscle, didn’t improve angina better than a placebo either. We continue to work backward and use placebo-controlled research to try to persuade people not to do procedures, rather than use it to prove conclusively that they work in the first place.

A study published in 2003, without a sham placebo control, showed that vertebroplasty — treating back pain by injecting bone cement into fractured vertebrae — worked better than no procedure at all. From 2001 through 2005, the number of Medicare beneficiaries who underwent vertebroplasty each year almost doubled, from 45 to 87 per 100,000. Some of them had the procedure performed more than once because they failed to achieve relief. In 2009, not one but two placebo-controlled studies were published proving that vertebroplasty for osteoporotic vertebral fractures worked no better than faking the procedure.

Over time, after the 2002 study showing that arthroscopic surgery didn’t work for osteoarthritis of the knee, the number of arthroscopic procedures performed for this condition did begin to go down. But at the same time, the number of arthroscopic procedures for tears of the meniscus cartilage in the knee began to go up fast. Soon, about 700,000 of them were being performed each year, with direct costs of about $4 billion. Less than a year ago, many were shocked when arthroscopic surgery for meniscal tearsperformed no better than sham surgery. This procedure was the most common orthopedic procedure performed in the United States.

The ethical issues aren’t easily dismissed. Theoretically, a sugar pill carries no risk, and a sham procedure does. This is especially true if the procedure requires anesthesia. The surgeon must go out of his or her way to fool the patient. Many would have difficulty doing that.

But we continue to ignore the real potential that many of our surgical procedures and medical devices aren’t doing much good — and might even be doing harm, since real surgery has been shown to pose more risks than sham surgery.

Rita Redberg, in a recent New England Journal of Medicine Perspectives article on sham controls in medical device trials, noted that in a recentsystematic review of migraine prophylaxis, while 22 percent of patients had a positive response to placebo medications and 38 percent had a positive response to placebo acupuncture, 58 percent had a positive response to placebo surgery. The placebo effect of procedures is not to be ignored.

Earlier this year, researchers published a systematic review of placebo controls in surgery. They searched the medical literature from its inception all the way through 2013. In all that time, they could find only 53 randomized controlled trials that included placebo surgery as one option. In more than half of them, though, the effect of sham surgery was equivalent to that of the actual procedure. The authors noted, though, that with the exception to the studies on osteoarthritis of the knee and internal mammary artery ligation noted above, “most of the trials did not result in a major change in practice.”

We have known about the dangers of ignoring the need for placebo controls in research on surgical procedures for some time. When the few studies that are performed are published, we ignore the results and their implications. Too often, this is costing us many, many billions of dollars a year, and potentially harming patients, for no apparent gain.

@aaronecarroll

Share

Placebo historyPosted: 09 Oct 2014 03:00 AM PDT

Here are my highlights from “Placebos and placebo effects in medicine: historical overview,” by Anton de Craen and colleagues. All are direct quotes.

  • In 1807 Thomas Jefferson, recording what he called the pious fraud, observed that ‘one of the most successful physicians I have ever known has assured me that he used more bread pills, drops of colored water, and powders of hickory ashes, than of all other medicines put together’. About a hundred years later, Richard Cabot, of Harvard Medical School, described how he ‘was brought up, as I suppose every physician is, to use placebo, bread pills, water subcutaneously, and other devices’.
  • The word placebo (Latin, ‘I shall please’) was first used in the 14th century. In that period, it referred to hired mourners at funerals. These individuals often began their wailings with Placebo Domino in regione vivorum, the ninth verse of psalm cxiv, which in the Latin Vulgate translation means ‘I shall please the Lord in the land of the living’. Here, the word placebo carries the connotation of depreciation and substitution, because professional mourners were often stand-ins for members of the family of the deceased.
  • In 1801, John Haygarth reported the results of what may have been the first placebo-controlled trial. A common remedy for many diseases at that time was to apply metallic rods, known as Perkins tractors, to the body. These rods were supposed to relieve symptoms through the electromagnetic influence of the metal. Haygarth treated five with imitation tractors made of wood and patients found that four gained relief. He used the metal tractors on the same five patients the following day and obtained identical results: four of five subjects reported relief.
  • In the 1785 New Medical Dictionary, placebo is described as ‘a commonplace method or medicine’. In 1811, the revised Quincy’s Lexicon-Medicum as ‘an epithet given to any medicine adapted defines placebo more to please than to benefit the patient’.
  • In the 1930s, several important papers were published with regard to the introduction of placebos in clinical research. [... Two] papers assessed the value of drugs used in the treatment of angina pectoris in cross-over experiments and deceptively administered placebos to the ‘no-treatment’ comparison group. [...] In both trials the drugs were judged to exert no specific action that might be useful in the treatment of angina. Gold and colleagues tried to explain why inert interventions might work: their points included ‘confidence aroused in a treatment’, the ‘encouragement afforded a new and ‘a of medical by procedure’ change advisor’.
  • Placebo was a fraud and deception that had the ‘moral effect of a remedy given specially for the disease’, but placebos did not affect the natural course of disease; they were a priori excluded from having such an impact. Placebos were therapeutic duds to manage patients, or, as in the Flint investigation, a camouflage behind which to watch nature take its course.
  • In 1938, the word placebo was first applied in reference to the treatment given to concurrent controls in a trial.
  • The efficacy of cold vaccines was evaluated in several placebo-controlled trials. [...] The conclusion [of one] reads ‘one of the most significant aspects of this study is the great reduction in the number of colds which the members of the control groups reported during the experimental period. In fact these results were as good as many of those reported in uncontrolled studies which recommended the use of cold vaccines’. The placebo effect was born.

@afrakt

Share

BU well represented at ASSA meetings in 2015

As would be expected since the Allied Social Science Association (ASSA) meetings are in Boston this January, BU is well represented on the ASSA program. After searching and scanning through the program for current and former students and current faculty, I identified 81 BU affiliate names on the program, whether as authors, discussants or presiding. This includes 17 of our regular BU economics faculty. The full list with affiliations is shown below. Note that his reflects not only economics department members, but also SMG, SPH, Political Science, Law or whatever may be the current affiliation.

In 2014, when the meetings were in Philadelphia, there were 70 BU affiliates participating.
This count is almost certainly an undercount, since recognizing the names of BU alumni is imprecise. I apologize for missing some names.

If one restricts the count to only names of current BU affiliates then there are 57 names affiliated with BU, which is ahead of BC (32) and Brown (21) but well behind our neighbors of Harvard (270) and MIT (152). We seem to rank about 15th. We still have a ways to go!

As usual (always?) there will be a BU reception at the meetings. This year it will be Sunday January 4 6-8 p.m. in the Westin Hotel. Look in the program for the exact room.

It is not too early to plan on submiting for the next ASSA meetings:

January 3-5, 2016 (Sunday, Monday & Tuesday) San Francisco, CA Hilton San Francisco

Preliminary Program for 2015 is linked here.

https://www.aeaweb.org/Annual_Meeting/index.php

BU affiliates, with duplicate names signifying each role time a name appears on the program.:

Ahmed Galal      Economic Research Forum and former Finance Minister of Egypt
Alfredo Burlando             University of Oregon
Alisdair McKay   Boston University
Andrew F. Newman       Boston University and CEPR
Angela Dills         Providence College
Austin Frakt        Boston University
Berardino Palazzo            Boston University
Carola Frydman                Boston University
Carola Frydman                Northwestern University
Cathie Jo Martin               Boston University
Ching-to Albert Ma         Boston University
Claudia Olivetti  Boston University
Claudia Olivetti Boston University
Daniele Paserman           Boston University
Dara Lee Luca    Harvard University and University of Missouri
Dara Lee Luca    University of Missouri and Harvard University
Dirk Hackbarth Boston University
Evgeny Lyandres              Boston University
Francesco Decarolis        Boston University
Giorgos Zervas Boston University
Giulia La Mattina              University of South Florida
Gustavo Schwenkler      Boston University
Hiroaki Kaido      Boston University
Ivan Fernandez-Val         Boston University
Jae W. Sim          Federal Reserve Board
James Rebitzer                 Boston University
Jerome Detemple           Boston University
Jianjun Miao      Boston University
Jing Guo               American Institutes for Research
Julie Shi                Harvard University
Kathleen Carey                 Boston University
Kehinde Ajayi    Boston University
Keith Marzilli Ericson       Boston University
Kevin Gallagher                Boston University
Kevin Lang          Boston University
Koichiro Ito         Boston University
Kristopher Gerardi          Federal Reserve Bank of Atlanta
Leslie Boden      Boston University
Marc Rysman     Boston University
Marcel Rindisbacher       Boston University
Martha Starr      American University
Megan MacGarvie           Boston University
Pasquale Schiraldi            London School of Economics
Phillip H. Ross    Boston University
Randall Ellis         Boston University
Robert Margo    Boston University
Rodolfo Prieto   Boston University
Rui Albuquerque              Boston University
Samuel Bazzi      Boston University
Sean Horan         Université de Montréal
Shinsuke Tanaka              Tufts University
Shulamit Kahn   Boston University
Silvia Prina           Case Western Reserve University
Simon Gilchrist Boston University
Stefania Garetto              Boston University
Timothy Layton                 Boston University
Yorghos Tripodis               Boston University
Yuan Tian             Boston University
Yuping Tsai          Centers for Disease Control and Prevention


A model for US: $1 coins and no pennies

I just returned from a vacation in Ecuador (which is spectacular) but wanted to post about a wonderful feature of their monetary system.

Ecuador does not have its own currency but instead uses the US dollar as their only currency. US dollar bills and coins are used everywhere, which is very convenient for visitors. But they do two intelligent things.

* They do not use paper $1 bills, but instead rely almost solely on the US-minted Sacagawea dollar coins for transactions.

* They generally do not use pennies but instead round transactions to the nearest nickel.

(They do mint their own Ecuadorian US-size dimes, quarters and nickels to make up for their shortage, using the same front side but a different reverse. They must have imported millions of $1 dollar coins.)

Wouldn't be nice if the US adopted this system!


NEJM: Sham Controls in Medical Device Trials

Rita F. Redberg, M.D.

N Engl J Med 2014; 371:892-893September 4, 2014DOI: 10.1056/NEJMp1406388

(Bold emphasis added by RPE)

The problem:

Only 1% of all medical devices reach the market through the premarket-approval route — the only pathway that requires the submission of clinical data. Research has shown that premarket approvals are often based on data from one small trial that used surrogate end points and included only short-term follow-up.1

RCTs are rarely used:

“Blinded, randomized, controlled trials (RCTs), in which the proposed therapy is compared with a placebo or a “sham” (nontherapeutic) intervention, are common for drugs but rare for medical devices.”

Even complex, RCTs with invasive procedures are possible.

“…double-blind trials of fetal-tissue transplantation for Parkinson's disease, discussed by Freeman et al. (1999). The sham procedure involved making twist-drill holes in the patient's forehead and was considered necessary and ethical for determining whether there was an effect of treatment beyond the placebo effect (there was not).”

“Another important lesson on the value of sham controls came from vertebroplasty, a procedure in which bone cement is injected into a fractured vertebra for treatment of a compression fracture. Vertebroplasty became popular in the early 2000s, on the basis of observational studies and a nonrandomized trial. Fueled by position statements from various U.S. radiologic and neurologic surgical societies arguing the benefits of these procedures, the number of vertebroplasties performed in Medicare patients nearly doubled between 2001 and 2005, increasing from 45.0 to 86.8 per 100,000 enrollees.3 In 2009, however, RCTs that included a group assigned to receive a nontherapeutic procedure found that pain relief in the sham-procedure group was no different from that in the group that received the actual procedure.4

Placebo effects are even larger with procedures than with drugs.

“ Researchers at the Institute of Medical Psychology in Munich recently quantified that power for various types of placebo treatments in studies of migraine prophylaxis. They found that 58% of patients had a positive response to sham surgery and 38% had a positive response to sham acupuncture, while only 22% had a positive response to oral pharmacologic placebos.5

Conclusion: More RCTs are needed. But the article does not address the problem that even with RCTs it is hard to change physician practice.

Full article is here.
http://www.nejm.org/doi/full/10.1056/NEJMp1406388?query=TOC

Read Flash Boys by Michael Lewis

I just finished reading the book Flash Boys by Michael Lewis (author of Moneyball and the Big Short). I highly recommend it to economists as a quick read (270 pages) in accessible prose. Or anyone.

http://www.amazon.com/Flash-Boys-Wall-Street-Revolt/dp/0393244660/

Every economist should be aware of the grossly unfair trading practices that the SEC and NASDAQ have allowed to dominate virtually all stock trades. Lewis documents a large number of explicit rip off techniques from High Frequency Traders (HFT) (which include most of the major money managers) that affect every mutual fund, stock broker and stock trade conducted in the world.   While true that HFT create liquidity in the market so that traders can instantly sell whatever stocks at "the market price"  in whatever quantities, they do this at the cost of a significant tax on all such transactions and result in billions of dollars of revenue for the HFT companies. Basically, the HFT can influence the market price. This is done in plain sight (the title of chapter 1), not hidden in the form of impenetrable documents such as the the unsecured and overrated mortgage securities.

Since many of you won't read the book, here is a flavor in my own words.

Your pension fund ABC, which manages a few billions of dollars of stocks, is constantly buying and selling stocks on your behalf to maintain its portfolio. Say it  wants to buy 10,000 shares of Microsoft "at the current price" which is $41.90 (the most recently traded price right now on 6/30/2014). The official NASDAQ ticker price shows more than 10,000 shares are offered at $41.90. But as soon as ABC's bid to buy "at market" is executed, essentially all of those available shares are purchased by HFT within a few microseconds (i.e., a few millions of a second) BEFORE ABC's purchase, thereby bidding up the price. It could be a penny or it could be much much more, depending on how volatile the stock price is. Today, Microsoft has already varied by .82%, so the variation WITHIN A FEW MICROSECONDS can easily be that amount and you would not even know. Your price at the end of the day would be within the low and high for the day.  ABC pays say $41.95, and the HFTs pocket the extra five cents per share on the trade since they were able to purchase at $41.90 before selling it back to you a few microseconds later at $41.95.

You think that it doesn't matter much because it was only a few pennies on the transaction, and you hold onto your assets for years. But your pension fund is constantly buying and selling as more funds are added, taken out, or market shares of different stocks change. All of these transactions are "taxed" by the HFT firms who buy at below your bid price and then sell the stock to ABC at NO RISK. According to the book, the best HFT firms have traded for years and never had a losing day, since they only bet on sure things.

Here is a second example. You may think there is only one market for each stock, but actually there are more than a dozen different prices since a majority of all trades happen in "dark pools" which are private exchanges organized by the large money managers. The official offer price may appear to be $10.05 but you don't know that some of these dark pools have offer to sell prices of as little as $10.00.  What the market is supposed to do is that if you bid "at market" then you get the lowest value price, which would be $10. What actually happens is that the HFT firms turn this into two transactions, buying at $10.00 and selling  to you at $10.05. Again, it doesn't sound like much until you realize how many millions of transactions there are.

What I found particularly unfair is that the SEC has allowed all kinds of sleazy types of stock sales practices, involving small lot transactions, and bids for shares at prices that need not be honored. This makes it very low cost/low risk for the HFT to figure out who is buying or selling, and take advantage of it.

There is a new exchange called IEX that is trying to become a fair exchange, with some success, but it is getting major push back from the big players. Read more here. http://en.wikipedia.org/wiki/IEX

Congratulations to BU’s Class of 2014 Economics graduates!

Please celebrate the 463 Boston University students who earned degrees in Economics at Commencement over the weekend. This year the program contained:

17 Ph.D. recipients

207 Master's degree recipients (MA, MAPE, MAEP, MAGDE MA/MBA, BA/MA)

256 BA recipients (including BA/MA)

This represents a total of 463 degrees!

These numbers undercount the total for the year since they exclude students who graduated in January 2014 and chose not to appear at Commencement.

The number of graduate degree recipients (234) remains close to the number of  BA students (256) both of which are down from the previous year, which was itself up 10% over 2012.

Last year (2013) there were 21 PhDs, 257 Master's degree recipients, and 292 BA recipients.

Altogether 23 Ph.D. students obtained jobs this year. To see their placements visit the web site linked here.

http://www.bu.edu/econ/gradprgms/phd/placements/

Many MA students did well on the job market and in being accepted to Ph.D. programs. For a partial list see:
http://www.bu.edu/econ/2014/05/16/ma-students-admitted-to-top-phd-programs/

The department's recently redesigned website now lists 38 regular professors, a number which is down two since 2012.
http://www.bu.edu/econ/people/faculty/

Congratulations to all!

Employer Sponsored Insurance Also Surged in MA in 2007.

There has been a great deal of surprise expressed in the media over the RAND’s latest report suggesting that more people have become insured through employer sponsored insurance (ESI) than through either Medicaid or the Exchanges under the ACA. One example is Adrianna McIntyre on The Incidental Economist who posted on Wednesday:

"I can’t overstate how stunning this finding is if it’s true; CBO expected that ESI gains and losses would pretty much break even in 2014 and that employer coverage would decline modestly in future years (p. 108)."

This result is precisely NOT stunning if you study the Massachusetts health reform.
In Massachusetts the expansion in ESI coverage ALSO led the total increase during the first year and half. Below is a  table summarizing the early returns in MA from a Massachusetts Division of Health Care Finance and Policy study in 2011.

http://www.mass.gov/chia/docs/r/pubs/11/2011-key-indicators-may.pdf

Notice how growth in ESI dominated both Medicaid and the Exchange in the first two years, before being surpassed by these other two.

I speculate that part of the reason so many Massachusetts employers dropped their plans in 2010 was because they knew they were not
compliant with the ACA new higher standard, but that is speculation. There was also a serious recession that affected employment and enrollment.

Massachusetts Health Reform http://www.mass.gov/chia/docs/r/pubs/11/2011-key-indicators-may.pdf
Insured Population by Insurance Types, 2006-2010
Excluding Medicare
Insured Population by Insurance Type, 2006-2010
June 30 2006 Dec 31 2006 Dec 31 2007 Dec 31 2008 Dec 31 2009 Dec 31 2010
Private Group 4,333,014 4,395,136 4,457,157 4,474,466 4,358,867 4,315,040
Individual Purchase 40,184 38,718 65,465 81,073 114,668 117,514
MassHealth 705,179 740,663 764,559 780,727 848,528 898,572
Commonwealth Care 0 18,327 158,194 162,725 150,998 158,973
Total Members 5,078,377 5,192,814 5,445,375 5,498,991 5,473,061 5,490,099
Change since 6/30/2006 June 30 2006 Dec 31 2006 Dec 31 2007 Dec 31 2008 Dec 31 2009 Dec 31 2010
Private Group 62,122 124,143 141,452 25,853 -17,974
Individual Purchase -1,466 25,281 40,889 74,484 77,330
MassHealth 35,484 59,380 75,548 143,349 193,393
Commonwealth Care 18,327 158,194 162,725 150,998 158,973
Total Members 114,437 366,998 420,614 394,684 411,722
Distribution of new enrollment as a fraction of total gains June 30 2006 Dec 31 2006 Dec 31 2007 Dec 31 2008 Dec 31 2009 Dec 31 2010
Private Group 54% 34% 34% 7% -4%
Individual Purchase -1% 7% 10% 19% 19%
MassHealth 31% 16% 18% 36% 47%
Commonwealth Care 16% 43% 39% 38% 39%
Total Members 100% 100% 100% 100% 100%


Explaining these two graphs should merit a Nobel prize

Reposting from The Incidental Economist Blog

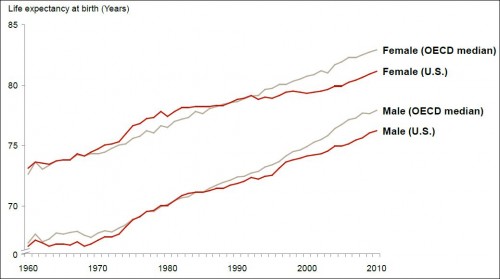
What happened to US life expectancy?

Posted: 07 Jan 2014 03:00 AM PST

Here’s another chart from the JAMA study “The Anatomy of Health Care in the United States”:

life expectancy at birth

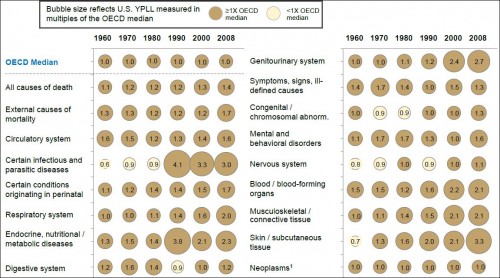
Why did the US fall behind the OECD median in the mid-1980s for men and the early 1990s for women? Note, the answer need not point to the health system. But, if it does, it’s not the first chart to show things going awry with it around that time. Before I quote the authors’ answer, here’s a related chart from the paper:

ypll

The chart shows years of potential life lost in the US as a multiple of the OECD median and over time. Values greater than 1 are bad (for the US). There are plenty of those. A value of exactly 1 would mean the US is at the OECD median. Below one would indicate we’re doing better. There’s not many of those.

It’d be somewhat comforting if the US at least showed improvement over time. But, by and large, it does not. For many conditions, you can see the US pulling away from the OECD countries beginning in/around 1980 or 1990, as was the case for life expectancy shown above. Why?

The authors’ answer:

Possible causes of this departure from international norms were highlighted in a 2013 Institute of Medicine report and have been ascribed to many factors, only some of which are attributed to medical care financing or delivery. These include differences in cultural norms that affect healthy behaviors (gun ownership, unprotected sex, drug use, seat belts), obesity, and risk of trauma. Others are directly or indirectly attributable to differences in care, such as delays in treatment due to lack of insurance and fragmentation of care between different physicians and hospitals. Some have also suggested that unfavorable US performance is explained by higher risk of iatrogenic disease, drug toxicity, hospital-acquired infection, and a cultural preference to “do more,” with a bias toward new technology, for which risks are understated and benefits are unknown. However, the breadth and consistency of the US underperformance across disease categories suggests that the United States pays a penalty for its extreme fragmentation, financial incentives that favor procedures over comprehensive longitudinal care, and absence of organizational strategy at the individual system level. [Link added.]

This is deeply unsatisfying, though it may be the best explanation available. Nevertheless, the sentence in bold is purely speculative. One must admit that it is plausible that fragmentation, incentives for procedures, and lack of organizational strategy could play a role in poor health outcomes in the US — they certainly don’t help — but the authors have also ticked off other factors. Which, if any, dominate? It’s completely unclear.

Apart from the explanation or lack thereof, I also wonder how much welfare has been lost relative to the counterfactual that the US kept pace with the OECD in life expectancy and health spending. It’s got to be enormous unless there are offsetting gains in areas of life other than longevity and physical well-being. For example, if lifestyle is a major contributing factor, perhaps doing and eating what we want (to the extent we’re making choices) is more valuable than lower mortality and morbidity. (I doubt it, but that’s my speculation/opinion.)

(I’ve raised some questions in this post. Feel free to email me with answers, if you have any.)

@afrakt

Latest REPEC rating has BU economics at #10!

I know rankings of departments are always imprecise, but I think  BU Economics should be proud that REPEC, (REsearch Papers in EConomics), which measures research output on 31 dimensions and takes an average, currently puts us at #10 in the US, just behind Yale, and ahead of Penn, Brown, Michigan and Northwestern. Keep up the great productivity!


Here is the link.
http://ideas.repec.org/top/top.usecondept.html

In case it changes before you look, or your don't have time, here are the top 30 places.

Top 25% US Economics Departments
Please note that rankings can depend on the number of registered authors in the respective institutions. Register at the RePEc Author Service.
Rank	Institution	Score	Authors	Author shares
1	Department of Economics, Harvard University Cambridge, Massachusetts (USA)
	1.02	64	50.86
2	Economics Department, Massachusetts Institute of Technology (MIT)Cambridge, Massachusetts (USA)
	2.3	41	32.55
3	Department of Economics, University of Chicago Chicago, Illinois (USA)
	3.41	41	34.28
4	Department of Economics, Princeton University Princeton, New Jersey (USA)
	3.87	47	33.41
5	Department of Economics, University of California-Berkeley Berkeley, California (USA)
	4.16	45	34.66
6	Department of Economics, New York University (NYU) New York City, New York (USA)
	6.39	54	40.17
7	Department of Economics, School of Arts and Sciences, Columbia University New York City, New York (USA)
	7.58	52	40.63
8	Department of Economics, Stanford University Stanford, California (USA)
	8.18	55	44.19
9	Economics Department, Yale University 
New Haven, Connecticut (USA)
	9.62	52	30.74
10	Department of Economics, Boston University Boston, Massachusetts (USA)
	11.89	52	42.41
11	Department of Economics, University of Pennsylvania Philadelphia, Pennsylvania (USA)
	12.33	38	33.32
12	Economics Department, Brown University 
Providence, Rhode Island (USA)
	12.76	41	37.31
13	Economics Department, University of Michigan 
Ann Arbor, Michigan (USA)
	12.86	68	53.1
14	Department of Economics, Northwestern University 
Evanston, Illinois (USA)
	12.93	35	30.54
15	Finance & Economics Department, Graduate School of Business, Columbia University New York City, New York (USA)
	14.36	25	20.52
16	Department of Economics, University of California-San Diego (UCSD) La Jolla, California (USA)
	16.29	42	34.57
17	Department of Economics, University of California-Los Angeles (UCLA) Los Angeles, California (USA)
	16.9	42	32.8
18	Economics Department, University of Wisconsin-Madison Madison, Wisconsin (USA)
	20.34	36	24.97
19	Department of Economics, Cornell University Ithaca, New York (USA)
	20.53	45	28.04
20	Economics Department, Dartmouth College Hanover, New Hampshire (USA)
	21.04	30	27.25
21	Department of Economics, Boston College Chestnut Hill, Massachusetts (USA)
	21.32	46	40.43
22	Economics Department, University of California-Davis Davis, California (USA)
	22.1	38	34.98
23	Department of Economics, University of Maryland College Park, Maryland (USA)
	22.76	43	35.97
24	Economics Department, Georgetown University Washington, District of Columbia (USA)
	23.21	43	34.12
25	Department of Economics, Duke University Durham, North Carolina (USA)
	23.95	43	34.71
26	Department of Economics, Vanderbilt University Nashville, Tennessee (USA)
	25.5	33	31.14
27	Department of Economics, University of Minnesota Minneapolis, Minnesota (USA)
	26.67	27	20.99
28	Economics Department, Michigan State University East Lansing, Michigan (USA)
	27.5	38	32.35
29	Economics Department, Stern School of Business, New York University (NYU) New York City, New York (USA)
	27.98	23	20.61
30	Department of Economics, University of California-Santa Barbara (UCSB) Santa Barbara, California (USA)
	29.55	31	26.08

This page shows one of the many rankings computed with RePEc data. They 
are based on data about authors who have registered with the RePEc Author Service, institutions listed on EDIRC, bibliographic data collected by RePEc, citation analysis performed by CitEc and popularity data compiled by LogEc. To find more rankings, historical data and detailed methodology, click here. Or see the ranking FAQ.
These rankings take only into account institutions registered in EDIRC and authors registered with the RePEc Author Service
 and the institutions they claimed to be affiliated with. For US 
Economics Departments, these are 478 institutions. Institutions need 
satisfy the following criteria to be included: Institutions having the 
following words in its name or its name translation on EDIRC: Economics and one of School, Department, Division or Faculty; be located in the United States.


Grade inflation article – BU looks tough

A few quotes from a story in today's Boston Globe.

"Harvard, other schools still fighting grade inflation" The Boston Globe By Marcella Bombardieri. December 05, 2013

"At Yale College, where 62 percent of grades are in the A range, proposals to curb grade inflation are in doubt following student protests and faculty concern."

"After a Boston Globe analysis in 2001 found that an astonishing 91 percent of Harvard College students were graduating with honors, officials released data showing that 48.5 percent of grades were A’s and A-minuses, compared to 33.2 percent who received those marks in 1985."

"In response to the uproar that followed, the [Harvard] faculty capped honors — summa, magna, and cum laude — at 60 percent."

"In response to a professor’s question at Tuesday’s meeting of the [Harvard] Faculty of Arts and Sciences, Jay M. Harris, dean of undergraduate education, said that the median grade awarded to undergraduates is an A-minus, while the most frequently awarded grade is an A."

"Levine, president of the Woodrow Wilson National Fellowship Foundation, found in a national survey that 41 percent of students had grade point averages of A-minus or higher in 2009, compared to just 7 percent in 1969."

"A few universities emphasize strict grading, or what students unhappily call “grade deflation.” Boston University has been known for difficult grading for many years."

http://www.bostonglobe.com/metro/2013/12/05/with-its-most-common-grade-harvard-earns-disapproval-but-has-company/kCeheDYfuDjSRcM1sVljfK/story.html?s_campaign=email_BG_TodaysHeadline

Personal experience with the new Federal Exchange web site

Randall P. Ellis, Professor, Boston University Department of Economics and past president of the American Society of Health Economists.

Today, Tuesday Dec 3, I went on line to check out the new HealthCare.gov web site for selecting individual health insurance. I checked out options for enrolling in the Oxford County Maine. The web page now has a totally new feel and look to it. Most importantly, it allowed me to shop for different plan options without having to first pass through the extensive security barriers which used to prevent people from shopping until they established eligibility. Now, it is attractive and better than the Massachusetts exchange.

I clicked through 50 screens, and dozens of plans in the middle of Tuesday morning with no noticeable delays or glitches. (The Boston University benefits web site gave me more problems in recent weeks.)

The options look terrific to me, although I am covered at work and hence not eligible to enroll through the exchanges.

The premium in rural Oxford County Maine for a 20 year old in the lowest cost option is only $110 per month, without any government subsidy. That is astoundingly low compared to the overpriced policies that were previously available.

I also priced out a gold plan (Community Advantage) comparable to my coverage at Boston University for a family of three. Without any subsidy, that plan would be $1799 per month. The Anthem Blue Cross Blue Shield Gold Guided Access plan was $2013/month. At BU I am currently paying $1813 per month. So these two plans look reasonable to me in comparison. Of course my employer subsidizes my coverage, and many will be eligible for subsidies from the ACA or their employer.

Also new is the link to the Kaiser Family Foundation calculator, which allows the user to get an estimate of any savings that he or she is eligible for based on income and family size. I played with it for a while, and it worked well. I quickly used that calculator to calculate that a 39 year old in Oxford Maine earning $30,000 per year could expect to pay $3790 per year, and then receive a tax credit of $1278, bringing the total cost to $2512 per year which is 8.37%.

This new interface makes shopping on the exchanges simple and easy to understand.

Although terribly unpleasant, the flaws in the initial Healthcare.gov system promoted awareness and discussion in the media about the new exchanges, which is good. It also encouraged employers to step forward and offer coverage instead of relying on individuals. Both of these are very positive outcomes.

I predict that enrollments through the exchanges by the end of December will be below the initial, optimistic forecasts of the administration, but that millions more will enroll in early 2014 as people fill out their tax forms and are prompted to answer whether they have health insurance. In Massachusetts, that was a greater motivation to purchasing than the end of the calendar year.

Playing video games does not predict voilent behavoir in children

(Reposted from The Incidental Economist) This November 2013 UK study confirms what other studies have shown, which is that playing video games does not predict psychosocial adjustment problems in young children. Even watching 3 hours of TV per day in the UK has no meaningful association.

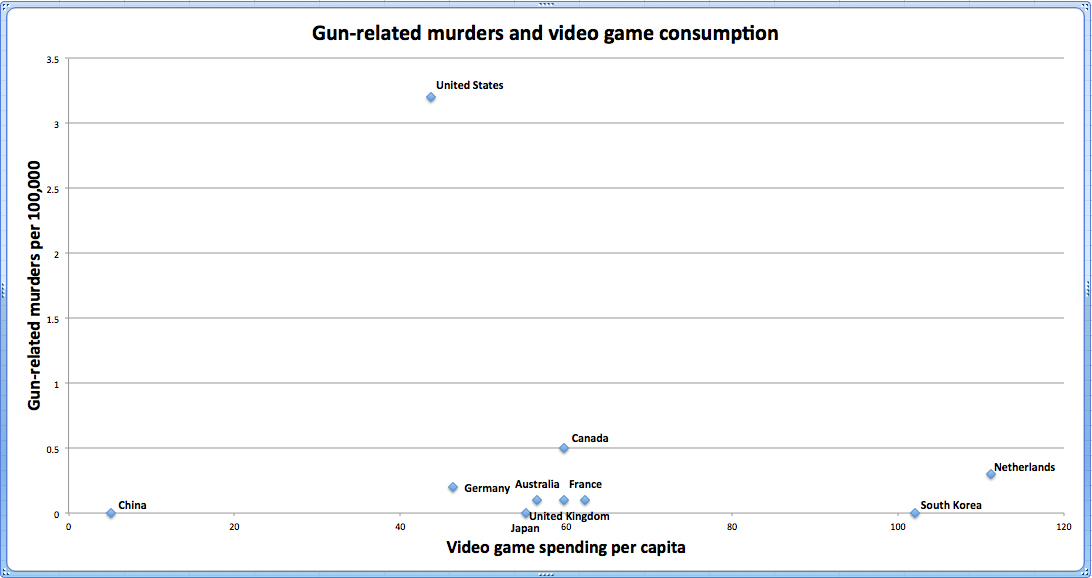
I also reposted my favorite graph about videos and gun violence from an earlier TIE posting.

Perhaps the 50th anniversary of  JFK's death, done with a $20 mail order rifle, is yet another good time to refocus on gun control.

Happy Thanksgiving!

Randy

The dangers of TV and video games
Posted: 25 Nov 2013 06:01 AM PST
From Archives of Diseases of Childhood, “
Do television and electronic games predict children’s psychosocial adjustment? Longitudinal research using the UK Millennium Cohort Study
“:

BACKGROUND: Screen entertainment for young children has been associated with several aspects of psychosocial adjustment. Most research is from North America and focuses on television. Few longitudinal studies have compared the effects of TV and electronic games, or have investigated gender differences.

PURPOSE: To explore how time watching TV and playing electronic games at age 5 years each predicts change in psychosocial adjustment in a representative sample of 7 year-olds from the UK.

METHODS: Typical daily hours viewing television and playing electronic games at age 5 years were reported by mothers of 11 014 children from the UK Millennium Cohort Study. Conduct problems, emotional symptoms, peer relationship problems, hyperactivity/inattention and prosocial behaviour were reported by mothers using the Strengths and Difficulties Questionnaire. Change in adjustment from age 5 years to 7 years was regressed on screen exposures; adjusting for family characteristics and functioning, and child characteristics.

RESULTS: Watching TV for 3 h or more at 5 years predicted a 0.13 point increase (95% CI 0.03 to 0.24) in conduct problems by 7 years, compared with watching for under an hour, but playing electronic games was not associated with conduct problems. No associations were found between either type of screen time and emotional symptoms, hyperactivity/inattention, peer relationship problems or prosocial behaviour. There was no evidence of gender differences in the effect of screen time.

CONCLUSIONS: TV but not electronic games predicted a small increase in conduct problems. Screen time did not predict other aspects of psychosocial adjustment. Further work is required to establish causal mechanisms.

Since we’re never going to have an RCT of TV or video games, these kinds of prospective cohort studies are important. In this one, they followed more than 11,000 children in the UK. They found that watching TV for three hours or more (a day!) at 5 years associated with a higher chance of having a conduct disorder at 7 years versus kids who watched less than an hour a day. How much of a difference? A 0.13 point increase in conduct problems. That corresponds, according to the article, to “0.09 of a SD [standard deviation] increase in age 7 years conduct score. Do you understand now? I don’t either.Anyway, the authors said it was a “small increase in conduct problems”.Video games? No effect.Yes, these are young kids, and it’s unlikely that they have been playing much GTA 5 or Battlefield 4. So I’ll look forward to more data. But that this point, it’s hard to point to a large study like this and find a smoking gun. Figuratively or literally.More on this topic here and here.@aaronecarrollShare

This is my favorite graph on this topic. From here

http://theincidentaleconomist.com/wordpress/wp-content/uploads/2012/12/video-game-chart-no-trendline.jpg

Two great reposts from TIE/JAMA

This repost from The Incidental Economist (TIE) is one of the best summaries of US Health Care I have seen. I also appended the Uwe posting at the bottom.

(The JAMA Authors are Hamilton Moses III, MD; David H. M. Matheson, MBA, JD; E. Ray Dorsey, MD, MBA; Benjamin P. George, MPH; David Sadoff, BA; Satoshi Yoshimura, PhD

The JAMA Article, which has an abundance of tables, references and graphs, will be on my MA and Ph.D. reading lists.

Anyone interested in keeping up with current US health policy from an economists point of view should subscribe to TIE, although it can be distracting, frustrating, and time consuming.

Randy

Study:The Anatomy of Health Care in the United States

Posted: 13 Nov 2013 03:55 AM PST

From JAMA. I reformatted the abstract, and broke it up into paragraphs to make it easier to read:

Health care in the United States includes a vast array of complex interrelationships among those who receive, provide, and finance care. In this article, publicly available data were used to identify trends in health care, principally from 1980 to 2011, in the source and use of funds (“economic anatomy”), the people receiving and organizations providing care, and the resulting value created and health outcomes.

In 2011, US health care employed 15.7% of the workforce, with expenditures of $2.7 trillion, doubling since 1980 as a percentage of US gross domestic product (GDP) to 17.9%. Yearly growth has decreased since 1970, especially since 2002, but, at 3% per year, exceeds any other industry and GDP overall.

Government funding increased from 31.1% in 1980 to 42.3% in 2011. Despite the increases in resources devoted to health care, multiple health metrics, including life expectancy at birth and survival with many diseases, shows the United States trailing peer nations. The findings from this analysis contradict several common assumptions. Since 2000,

  1. price (especially of hospital charges [+4.2%/y], professional services [3.6%/y], drugs and devices [+4.0%/y], and administrative costs [+5.6%/y]), not demand for services or aging of the population, produced 91% of cost increases;
  2. personal out-of-pocket spending on insurance premiums and co-payments have declined from 23% to 11%; and
  3. chronic illnesses account for 84% of costs overall among the entire population, not only of the elderly.

Three factors have produced the most change:

  1. consolidation, with fewer general hospitals and more single-specialty hospitals and physician groups, producing financial concentration in health systems, insurers, pharmacies, and benefit managers;
  2. information technology, in which investment has occurred but value is elusive; and
  3. the patient as consumer, whereby influence is sought outside traditional channels, using social media, informal networks, new public sources of information, and self-management software.

These forces create tension among patient aims for choice, personal care, and attention; physician aims for professionalism and autonomy; and public and private payer aims for aggregate economic value across large populations. Measurements of cost and outcome (applied to groups) are supplanting individuals’ preferences. Clinicians increasingly are expected to substitute social and economic goals for the needs of a single patient. These contradictory forces are difficult to reconcile, creating risk of growing instability and political tensions. A national conversation, guided by the best data and information, aimed at explicit understanding of choices, tradeoffs, and expectations, using broader definitions of health and value, is needed.

My frustration? That anyone treats any of this as news. At some point we need to stop diagnosing the problem and start doing something about it.

The whole thing is worth a read. But none of it will be news for regular visitors to TIE. Why isn’t everyone reading this blog already?!?!?!

@aaronecarroll

Quote: Uwe (Need I say more?)

Posted: 13 Nov 2013 04:00 AM PST

[T]he often advanced idea that American patients should have “more skin in the game” through higher cost sharing, inducing them to shop around for cost-effective health care, so far has been about as sensible as blindfolding shoppers entering a department store in the hope that inside they can and will then shop smartly for the merchandise they seek. So far the application of this idea in practice has been as silly as it has been cruel. [...]

In their almost united opposition to government, US physicians and health care organizations have always paid lip service to the virtue of market, possibly without fully understanding what market actually means outside a safe fortress that keeps prices and quality of services opaque from potential buyers. Reference pricing for health care coupled with full transparency of those prices is one manifestation of raw market forces at work.

-Uwe Reinhardt, The Journal of the American Medical Association. I thank Karan Chhabra for the prod.

@afrakt

AHRF/ARF 2012-13 data is available free

AHRF=Area Health Resource File (Formerly ARF)

2012-2013 ARHF can now be downloaded at no cost.

The 2012-2013 ARF data files and documentation can now be downloaded. Click the link below to learn how to download ARF documentation and data.

http://arf.hrsa.gov/

“The Area Health Resources Files (AHRF)—a family of health data resource
products—draw from an extensive county-level database assembled annually from
over 50 sources. The AHRF products include county and state ASCII files, an MS Access
database, an AHRF Mapping Tool and Health Resources Comparison Tools (HRCT). These
products are made available at no cost by HRSA/BHPR/NCHWA to inform health resources
planning, analysis and decision making..”

"The new AHRF Mapping Tool enables users to compare the availability of healthcare providers as well as environmental factors impacting health at the county and state levels."